Bitcoin Keeps Grinding Along- Broke Highs From September 2022!

Bitcoin keeps grinding along in a bullish mode, although momentum has been fading. The pumps haven’t been as big, but it keeps pushing the price through levels of resistance. There is no doubt that the trend is changing. It is apparent on multiple time frames, but we are over due for a pull back, except, the Bitcoin prices hasn’t seemed to agree. It’s like trying to put a toddler down for a nap, haha.
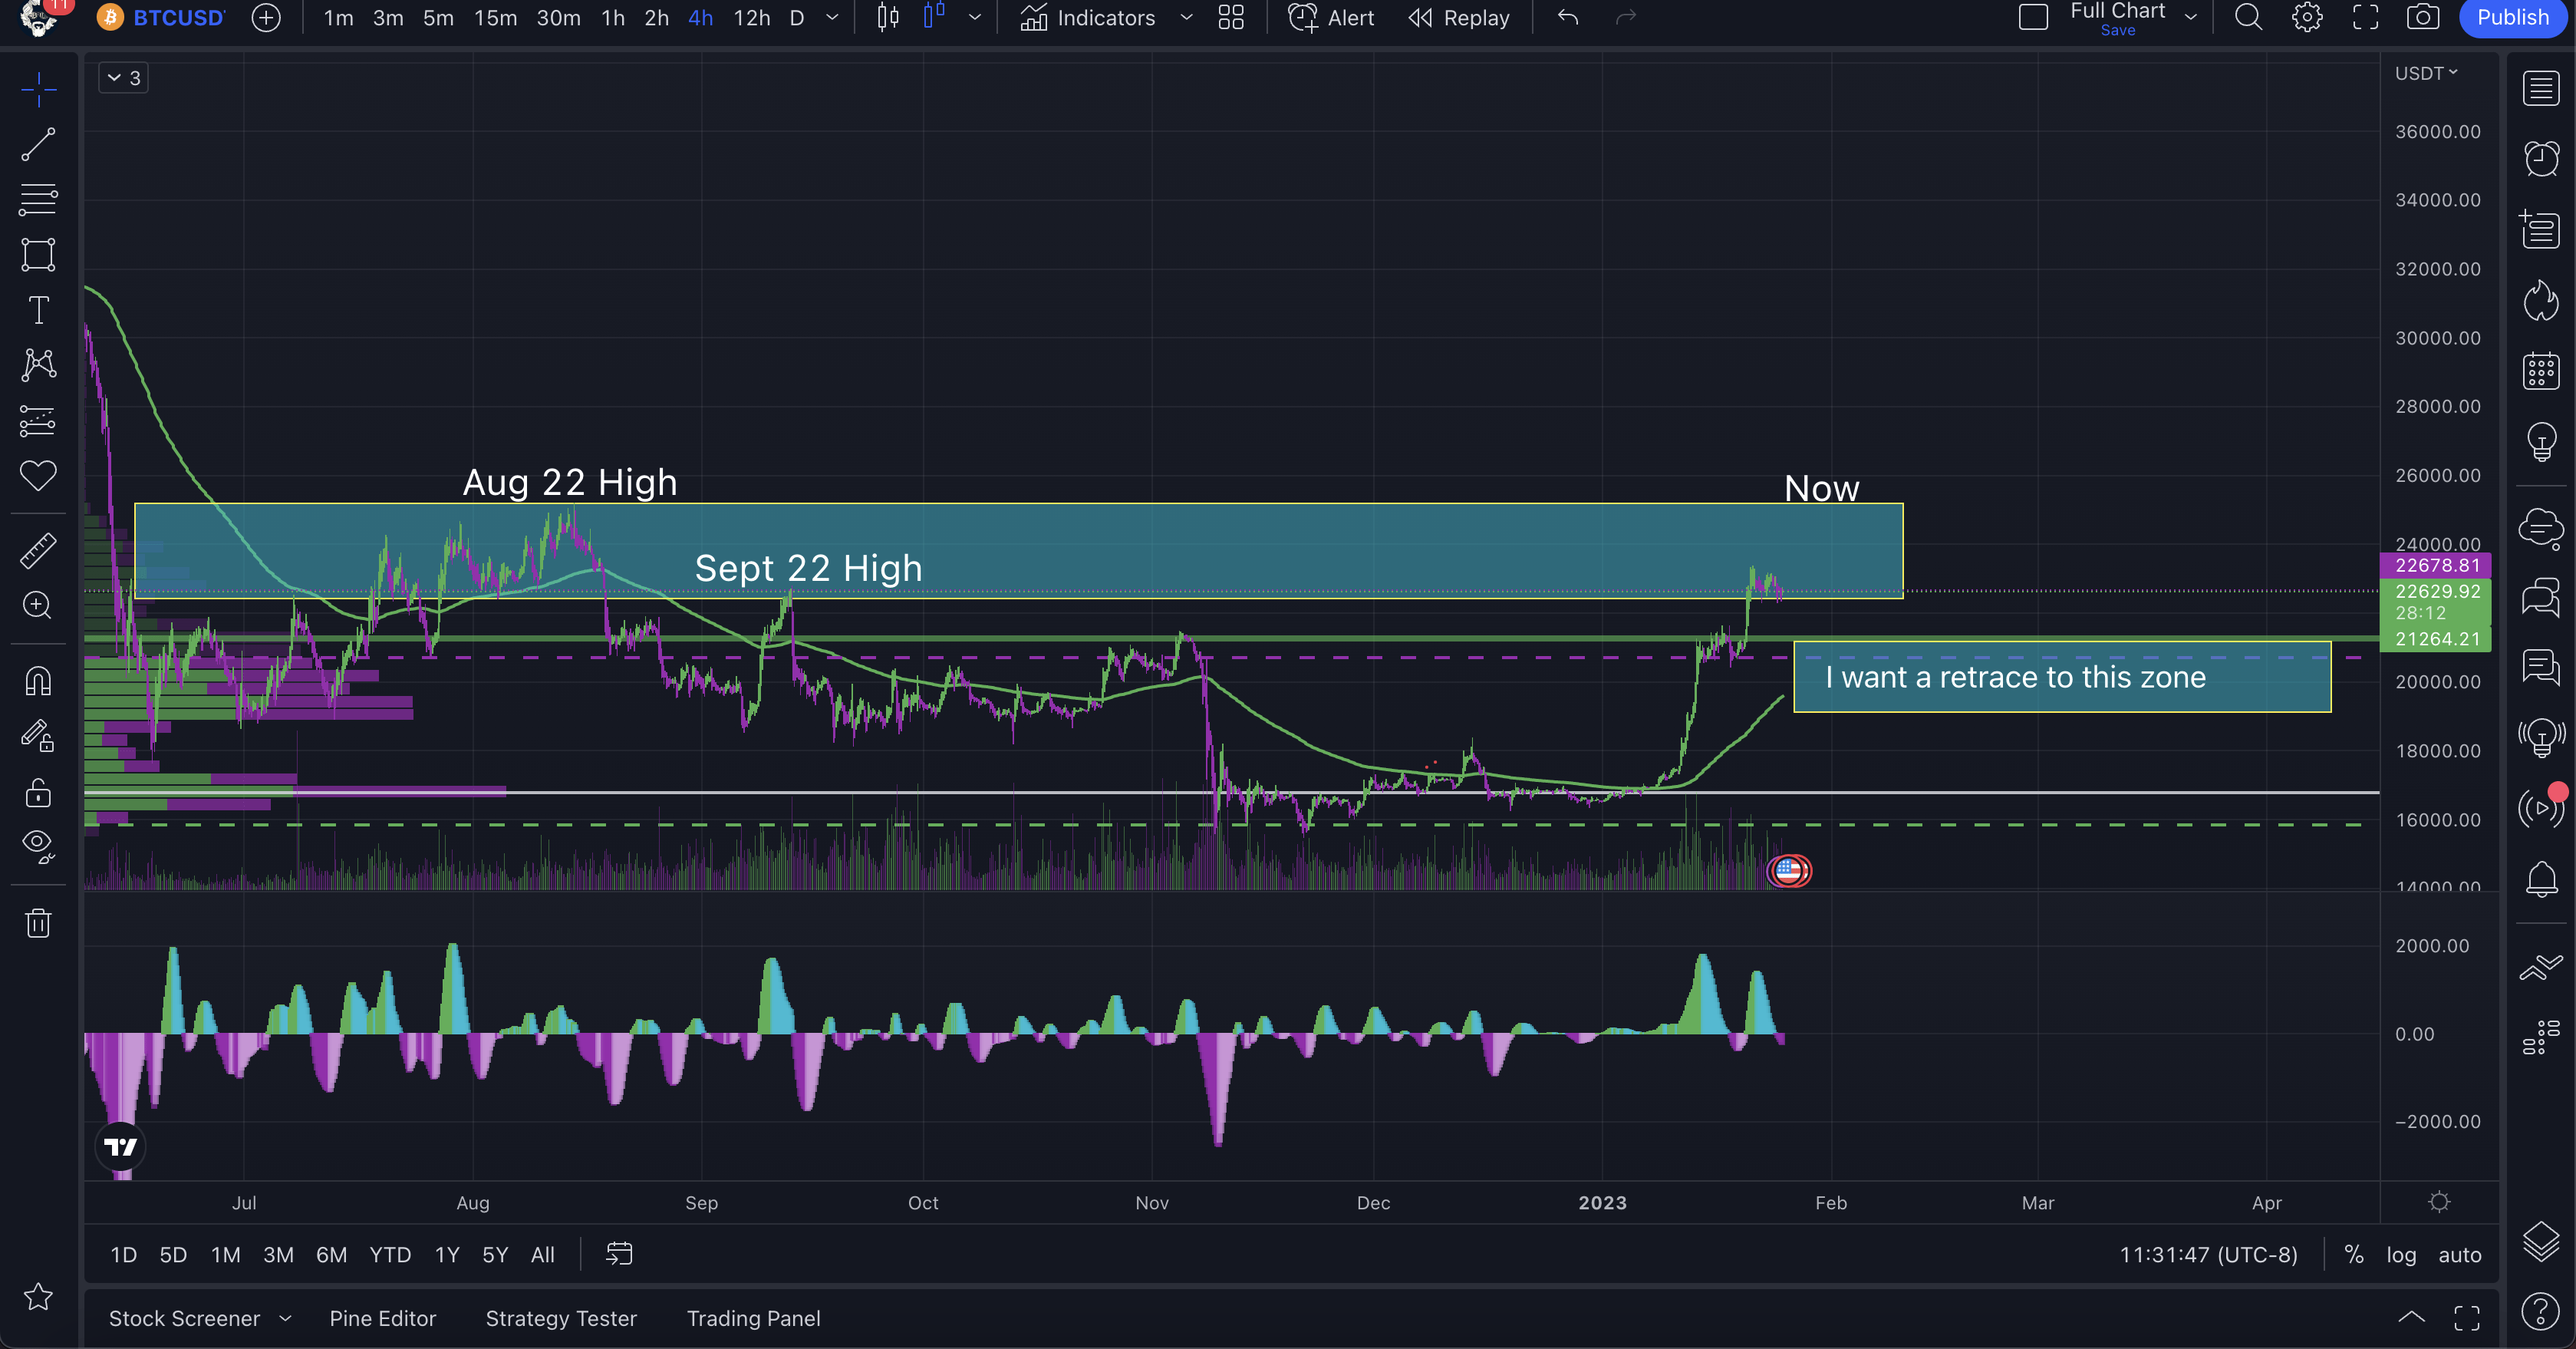
Based on the chart above which is the 4 hour time frame on Bitcoin, we are in a heavy zone of volume which we could range in for some time. I would like to see a correction down to around 19.5K-20K, which would fill the CME gap, but then we may not see that kind of a correction until we go up and touch the 25K range which would be the highest we have seen the price of Bitcoin since August 2022!
Bitcoin broke through resistance from September 2022!
As you also can see on the chart above, Bitcoin has broken above the highs set back in September 2022, and is currently finding that level as support. This could lead to another bullish move before we see the end of this rally. But as always I am taking it day by day. The next stop is around 25K set back in August of 2022!
Taking a step back

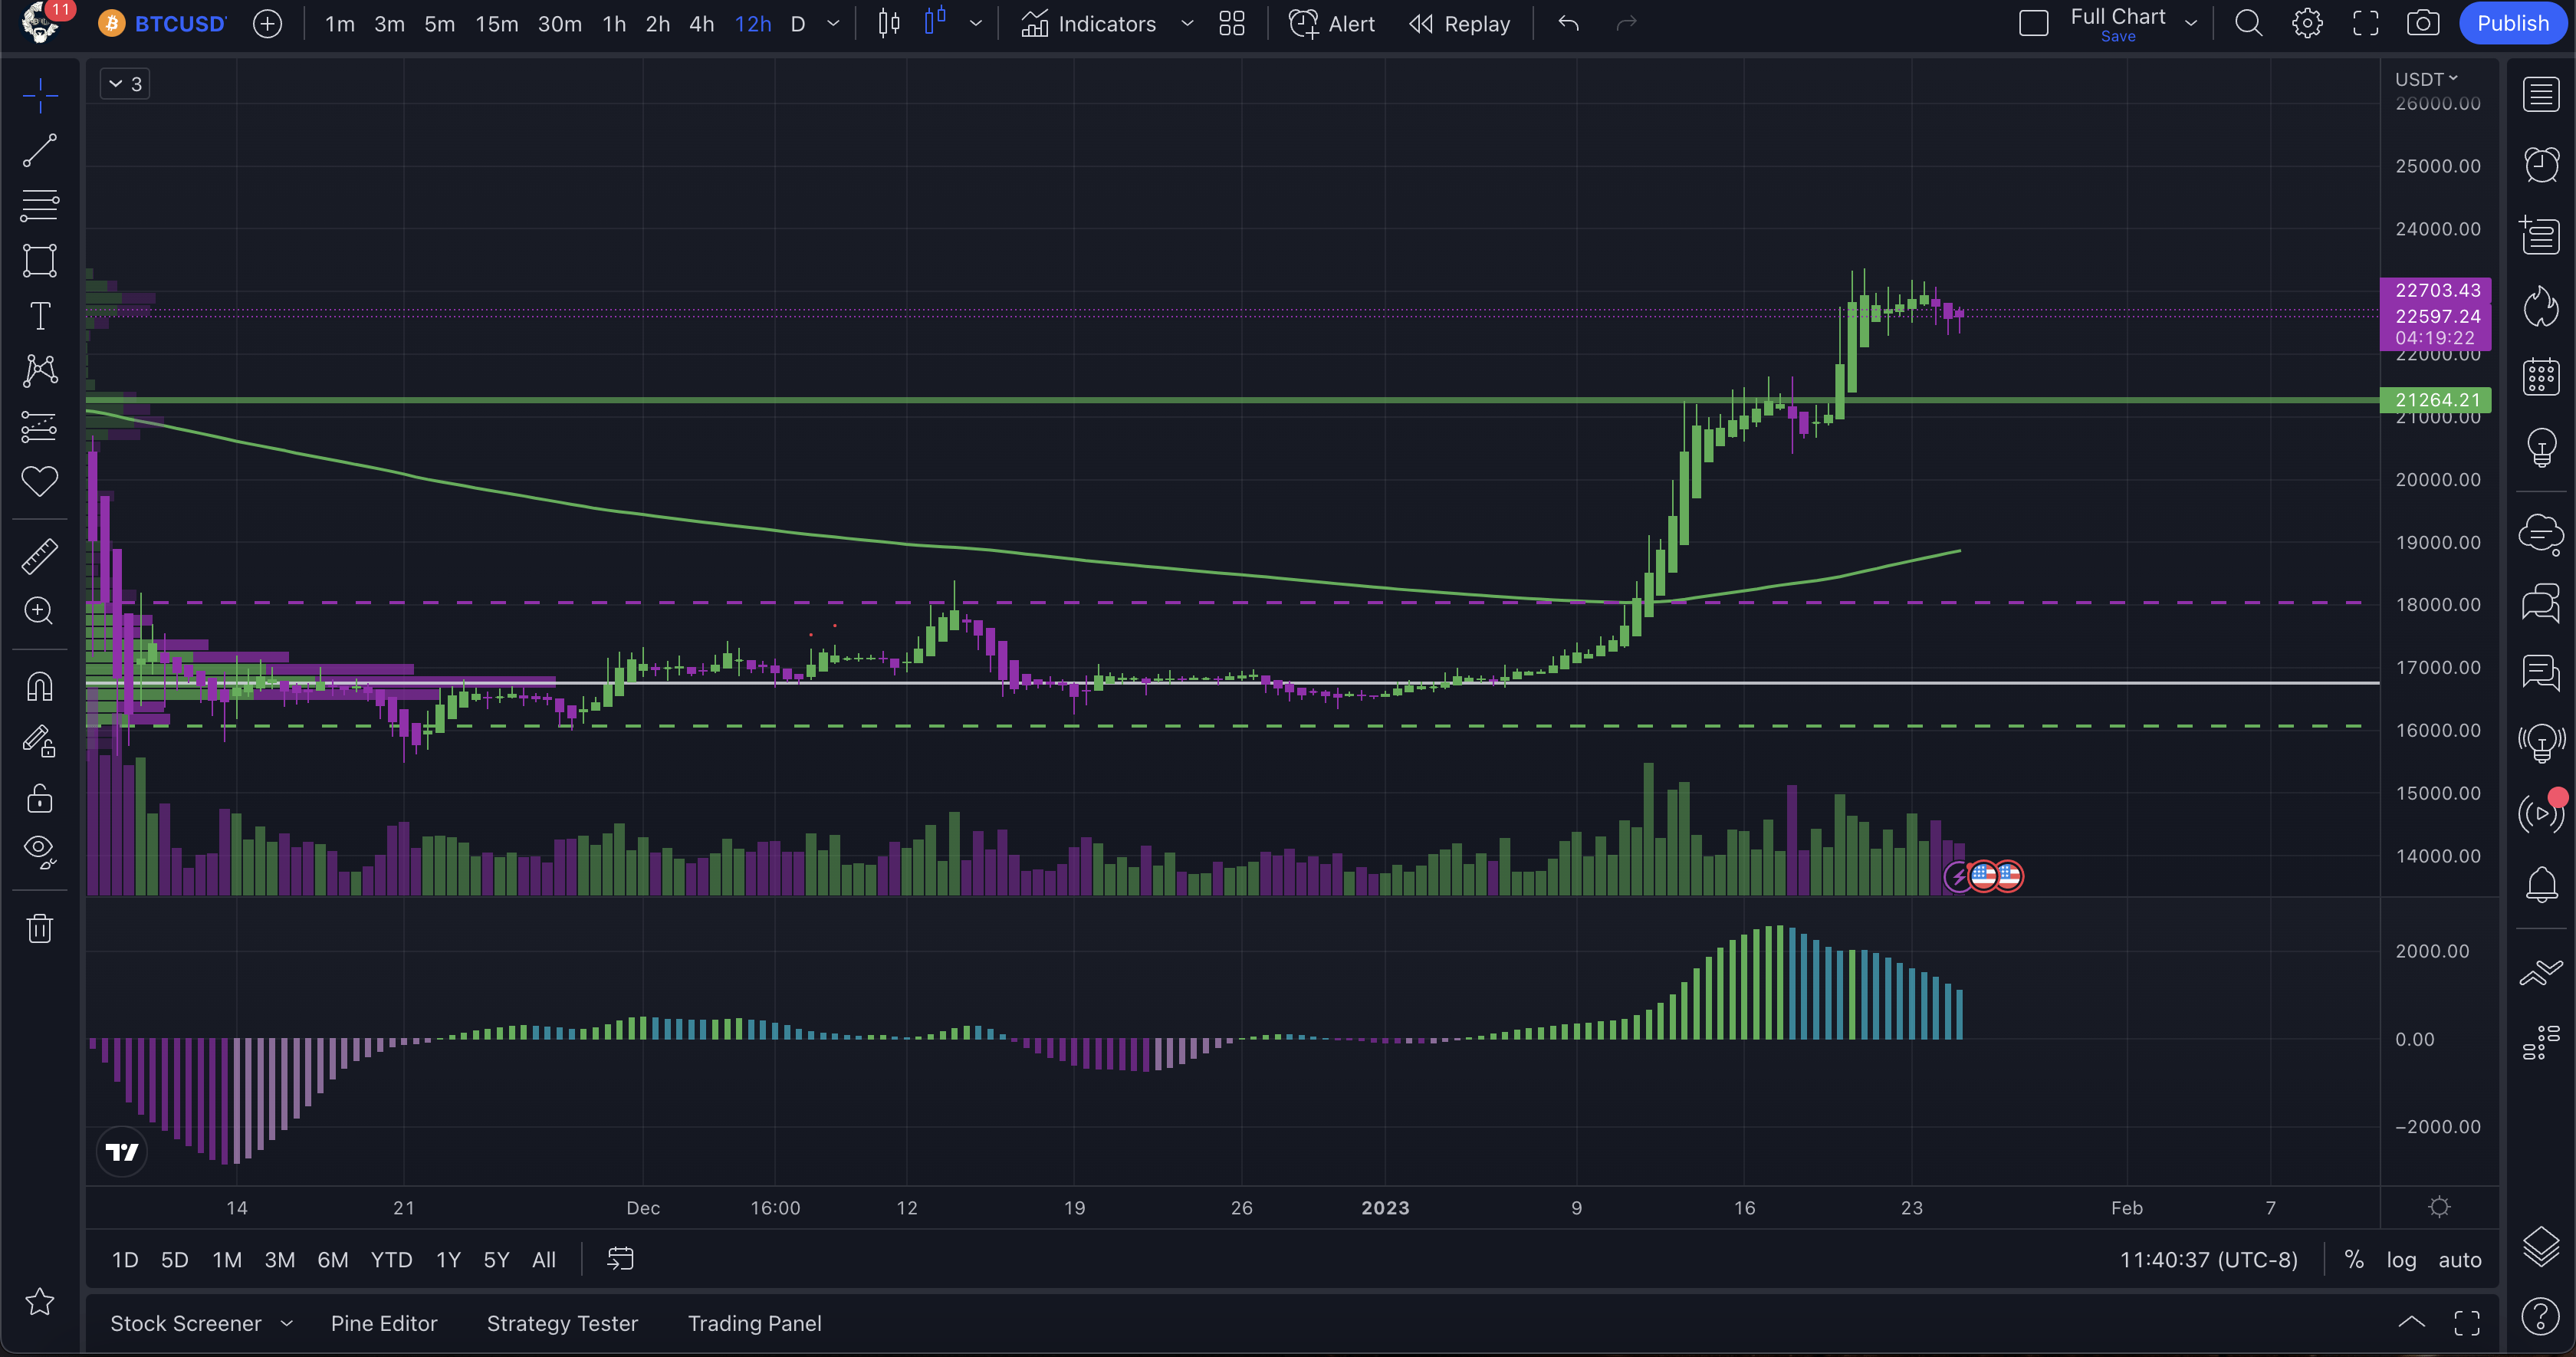
Taking a look at the 12 hour time frame, which I am finding is a nice longer term chart for Bitcoin is showing a consistent step up motion, but as you can see the momentum has topped out and is in decline based on the declining volume and the squeeze momentum indicator, which is basically a combination of the bollinger band and the stochastic RSI wrapped up in a momentum indicator.
With the price being securely above the 200 period moving average, this indicates that we are still in an uptrend, and based on my trading rules, I am still looking for long opportunities. Maybe something I look for on a longer term time frame for my spot trading account on Robinhood. This corresponds with the previous idea of making a climb back up to the 25K range set in August. It’s certainly possible but I would like to see it actually build market structure at these levels.
Zooming into the now

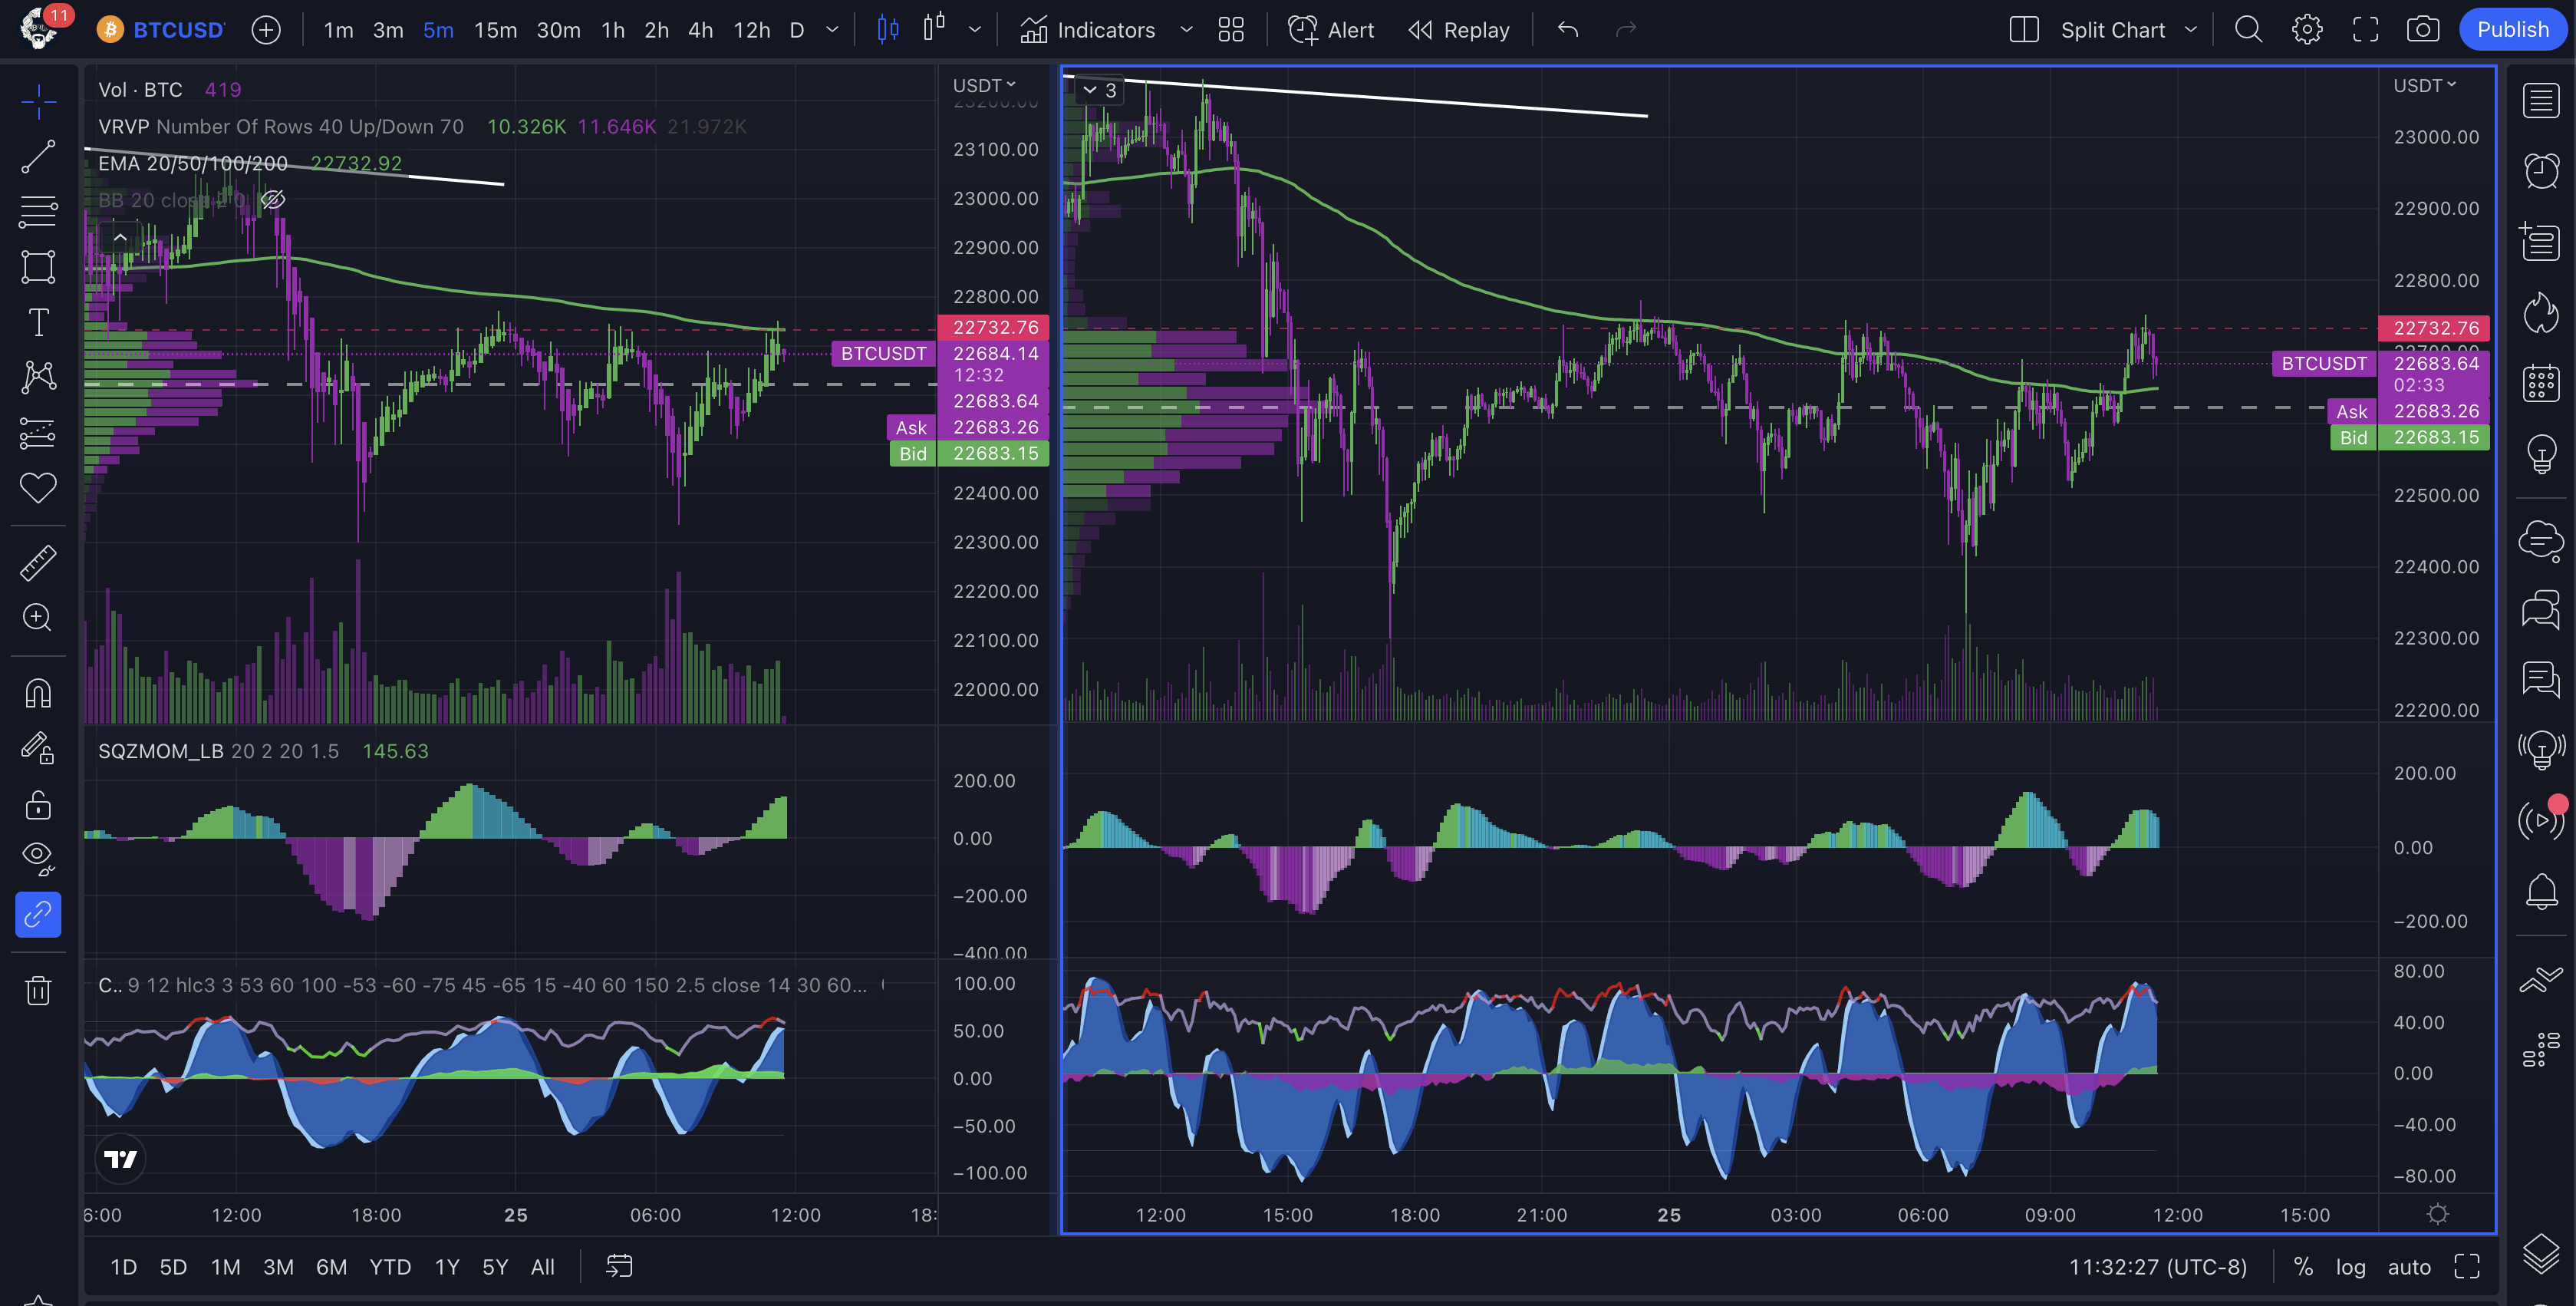
Taking a look at the short term time frames of the 15 minute (left) and the 5 minute (right) you can see that the price of Bitcoin is currently battling the 200 period moving average as resistance which let’s me know that the idea of the correction back to 19.5-20K is more in the cards before we make the trip back to 25K. But again, all we can do is watch the markets and take the trades as they come.
I am waiting for the squeeze indicator on the 15 minute to top out and start it’s decline, then I will look for short entries on the 5 minute time frame. Trading Bitcoin with high leverage on a small account on ApolloX Finance, which is a decentralized exchange on Binance Smart Chain (BSC) and now Ethereum. I use this for intraday trading while using Robinhood for my multi-day swing trades to hedge my bets that way. Once I get that account built back up enough I will start messing with options on mining and cannabis stocks.
Be safe out there in the markets, and make sure you are using all of your resources to make the most educated trade decisions possible!

Nothing said is financial advice.
This is for educational and recreational purposes only!
Stay safe in these volatile markets and don’t get rekt!
Follow the markets and get the latest data and news on Coin Logic
Any videos will be posted to Coin Logic TV on YouTube in addition to 3Speak:
https://www.youtube.com/coinlogictv
Upgrade to a paid Tradingview account and get more charts, indicators, screens and more!
Trade stocks, options, and cryptocurrency with us on Robinhood and pay no commissions! Use our link to sign up, link your account, and get a free stock!
Trade with us on Apollo X on BSC if you want to trade crypto with leverage in a decentralized fashion!

