Drawing The Line In The Sand For Bitcoin

At this point, there is no mistaking the major macro global issues plaguing all major markets, including crypto. Bitcoin has been no stranger to the downward volatility that the traditional markets have been experiencing. That is because it is still a risk on asset. But for a trader, it is time to really start watching for a move to capitalize on.
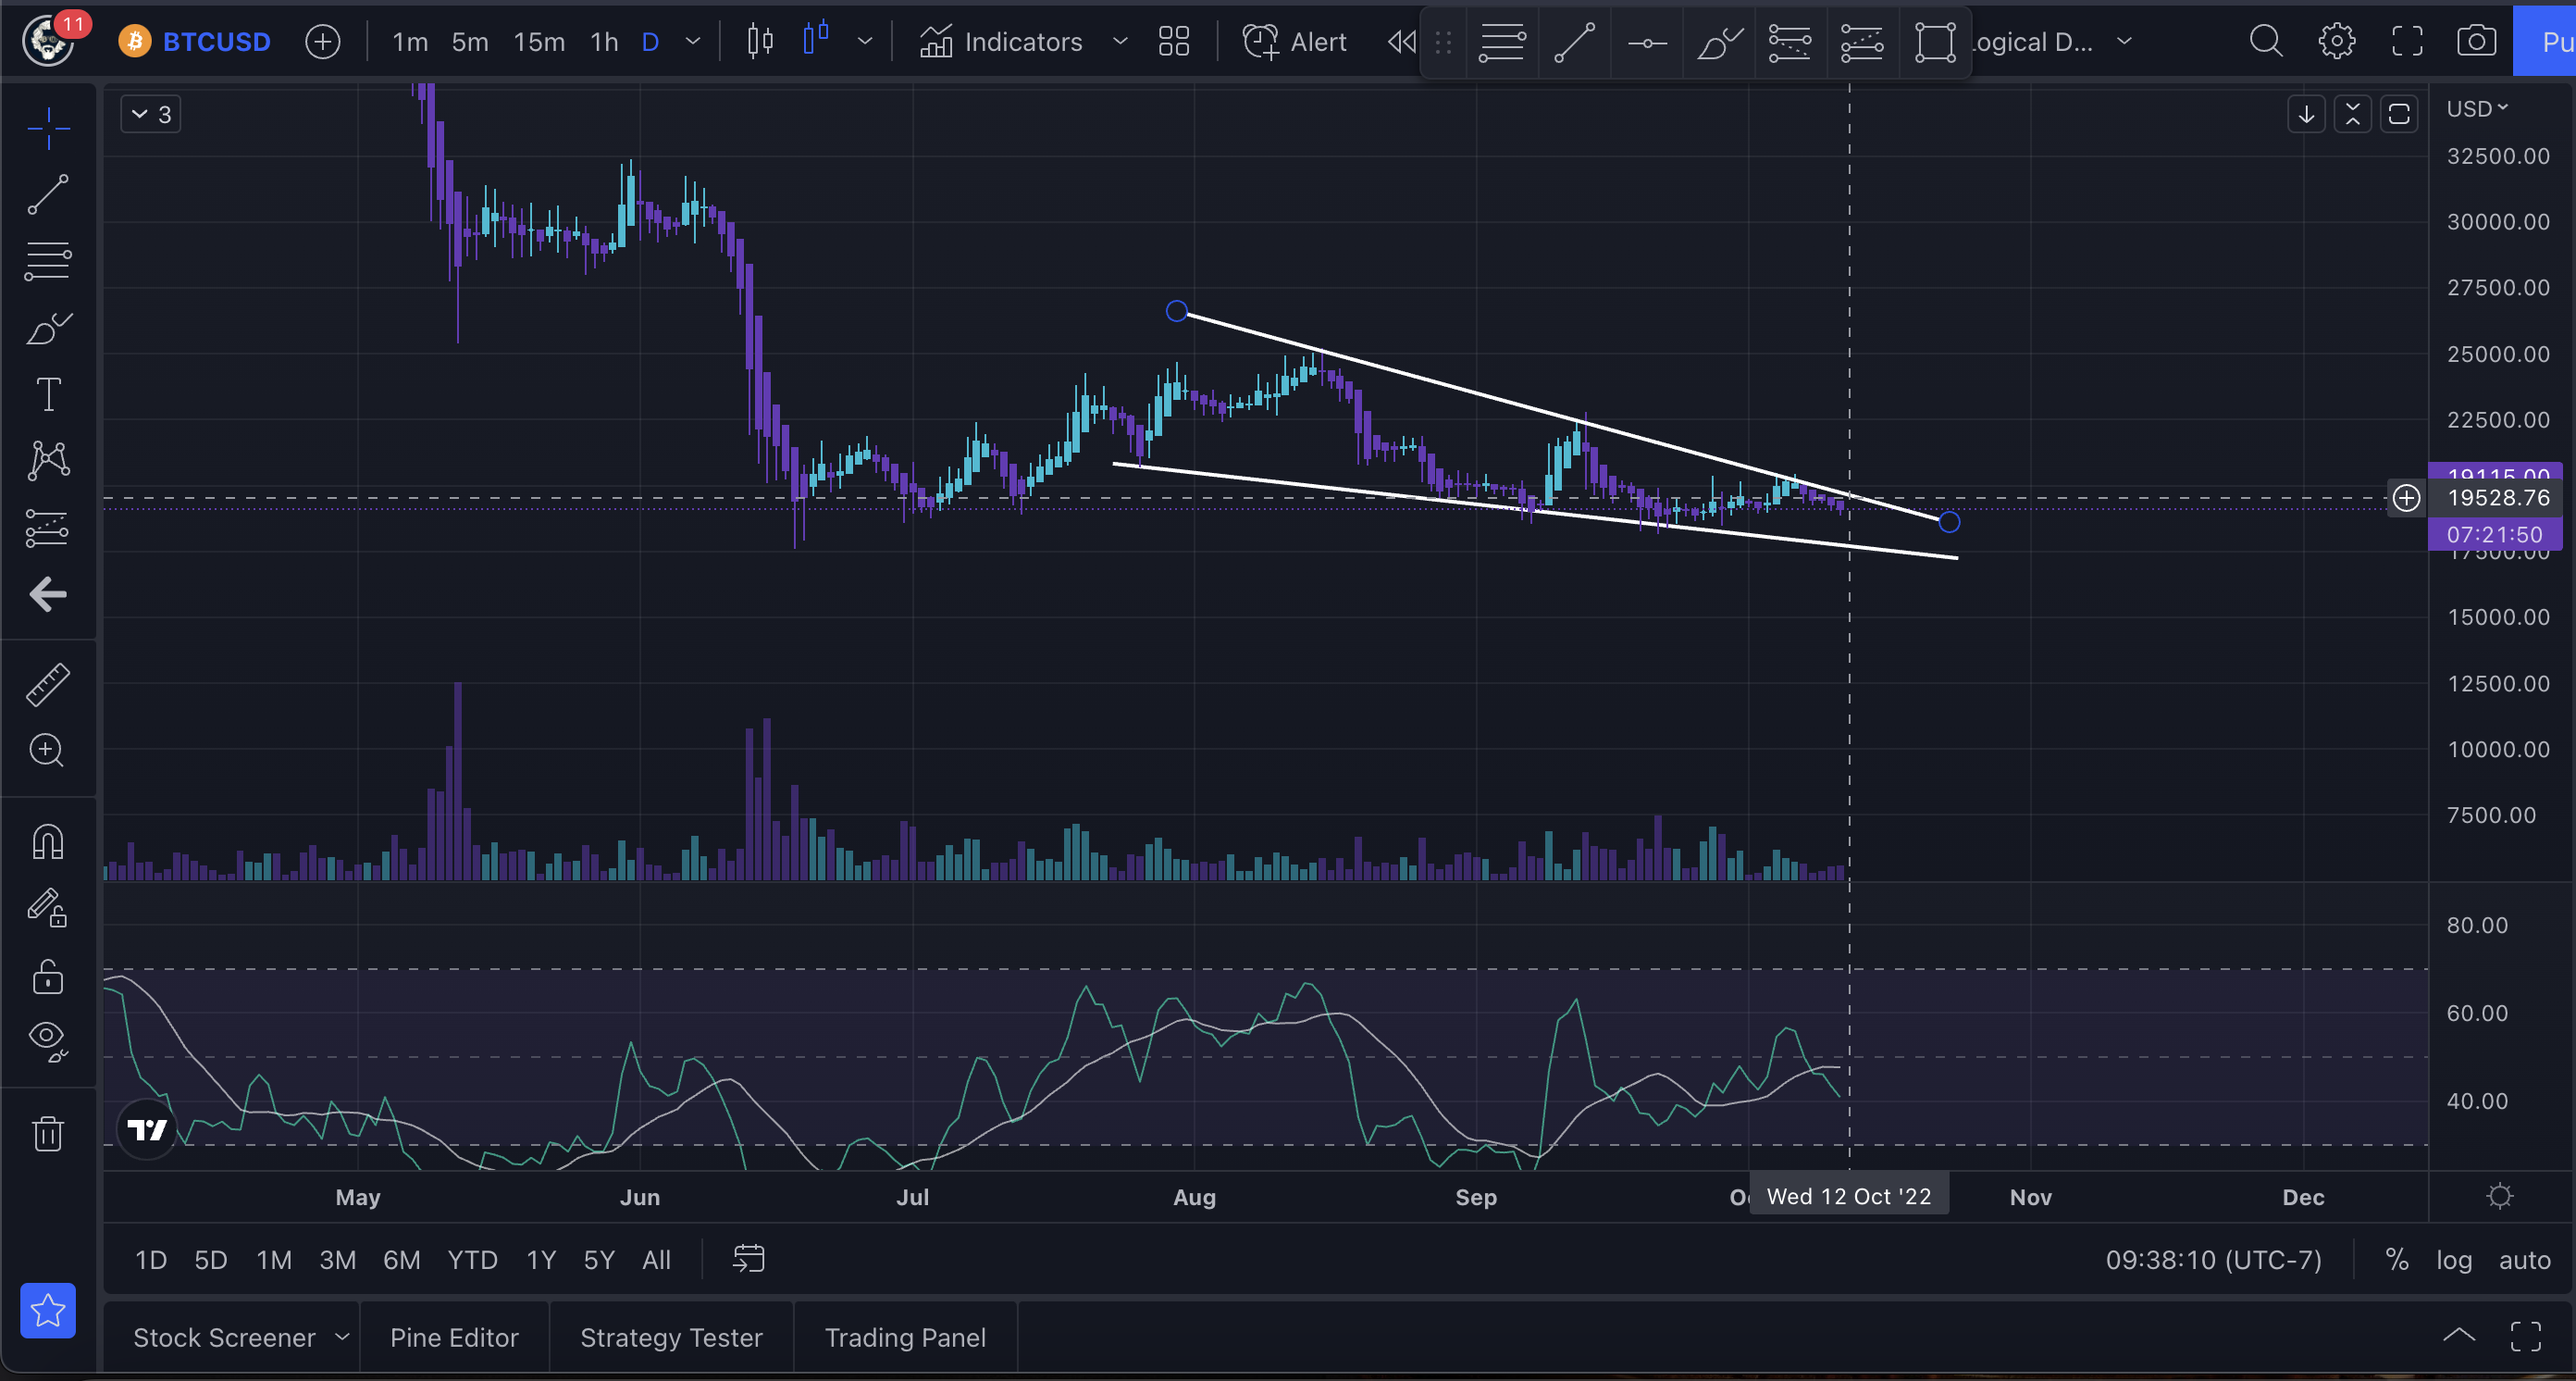
The chart above is showing Bitcoin on a daily time frame. It has formed a clear falling wedge which does break to the bullish side a good bit of the time. Where the line in the sand is being drawn is the lower support levels of this wedge. If Bitcoin continues downward, breaking this pattern, we are likely to see the $10K level, as nasty as that sounds for holders, it can be a great time to jump into Bitcoin… Not financial advice…
Looking For The Trade
With this setup, I am looking for a clear break in either direction before I make my move. Let’s take a look at some possibilities…

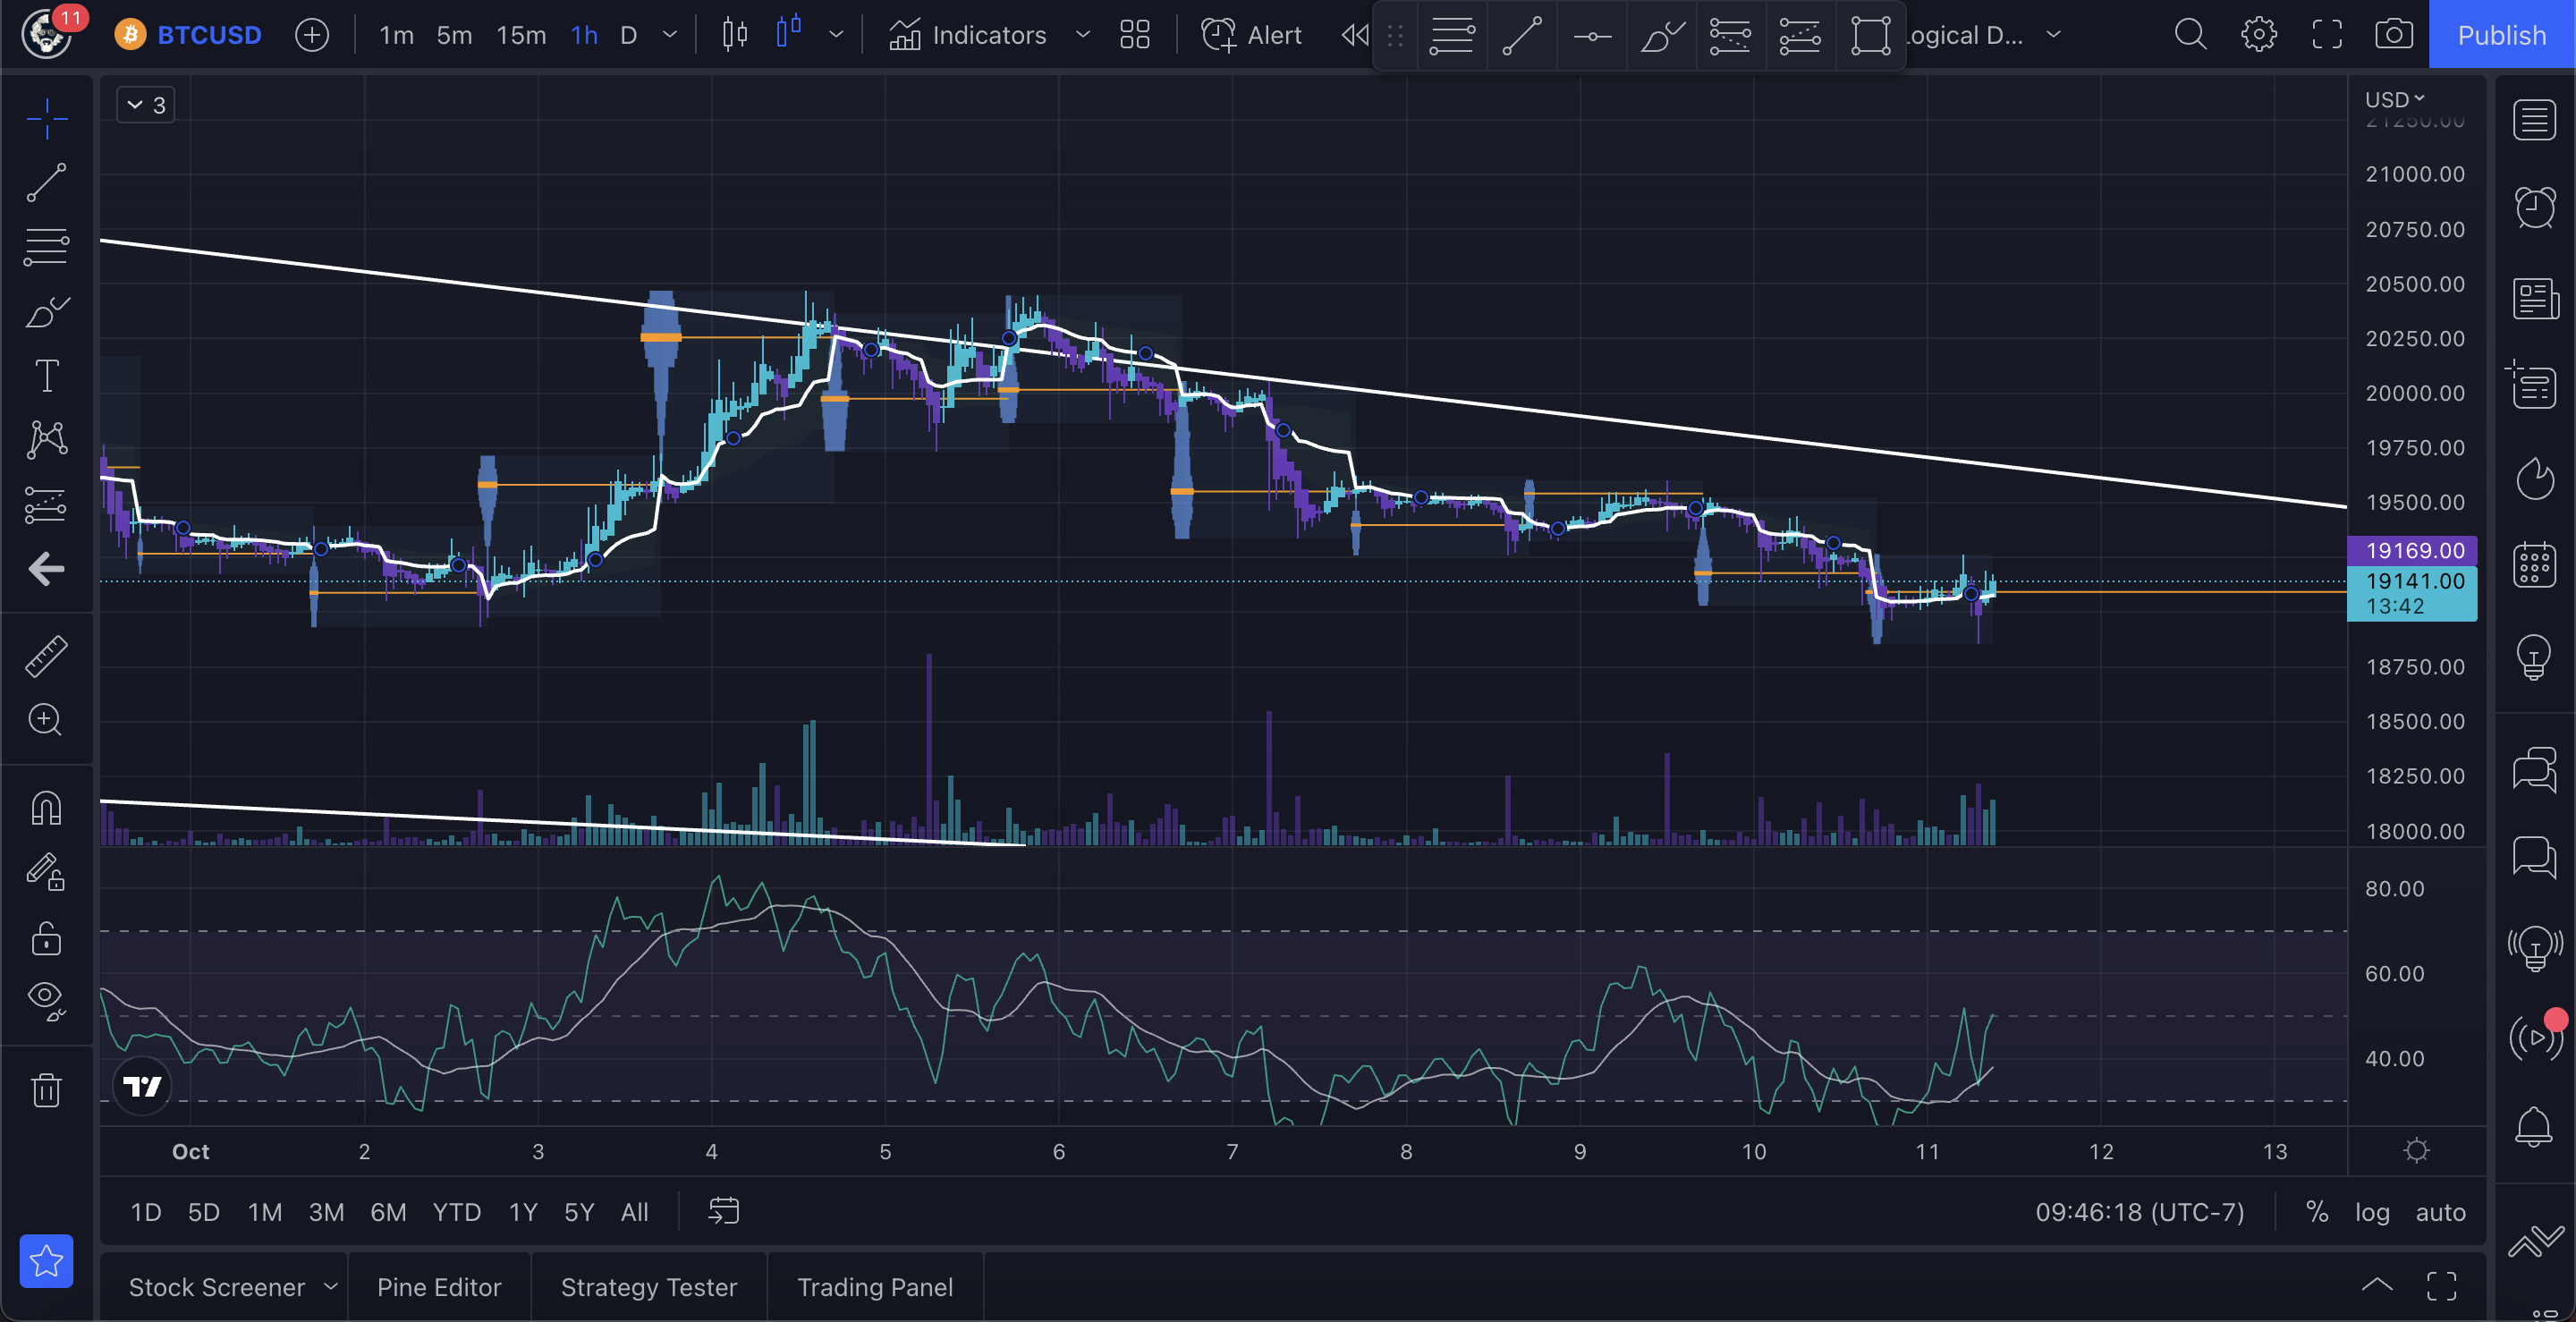
When you zoom into the 1-hour timeframe, you will see that Bitcoin is attempting to hold the current levels which have been previous reversal points. The price is currently riding right with the VWAP, so there is not much of a move to play at the moment, but what I am watching is for a break of the price to either side.
If prices hold this level and move to the upside, we will be meeting resistance at the trend line, but a break above that will indicate a change in trend. A break to the downside, and we just need to hope that the prices respect the bottom of the trend and bounce up, because like I said before, if it breaks to the downside, it’s going to be a down-slide…haha…
Short Term View

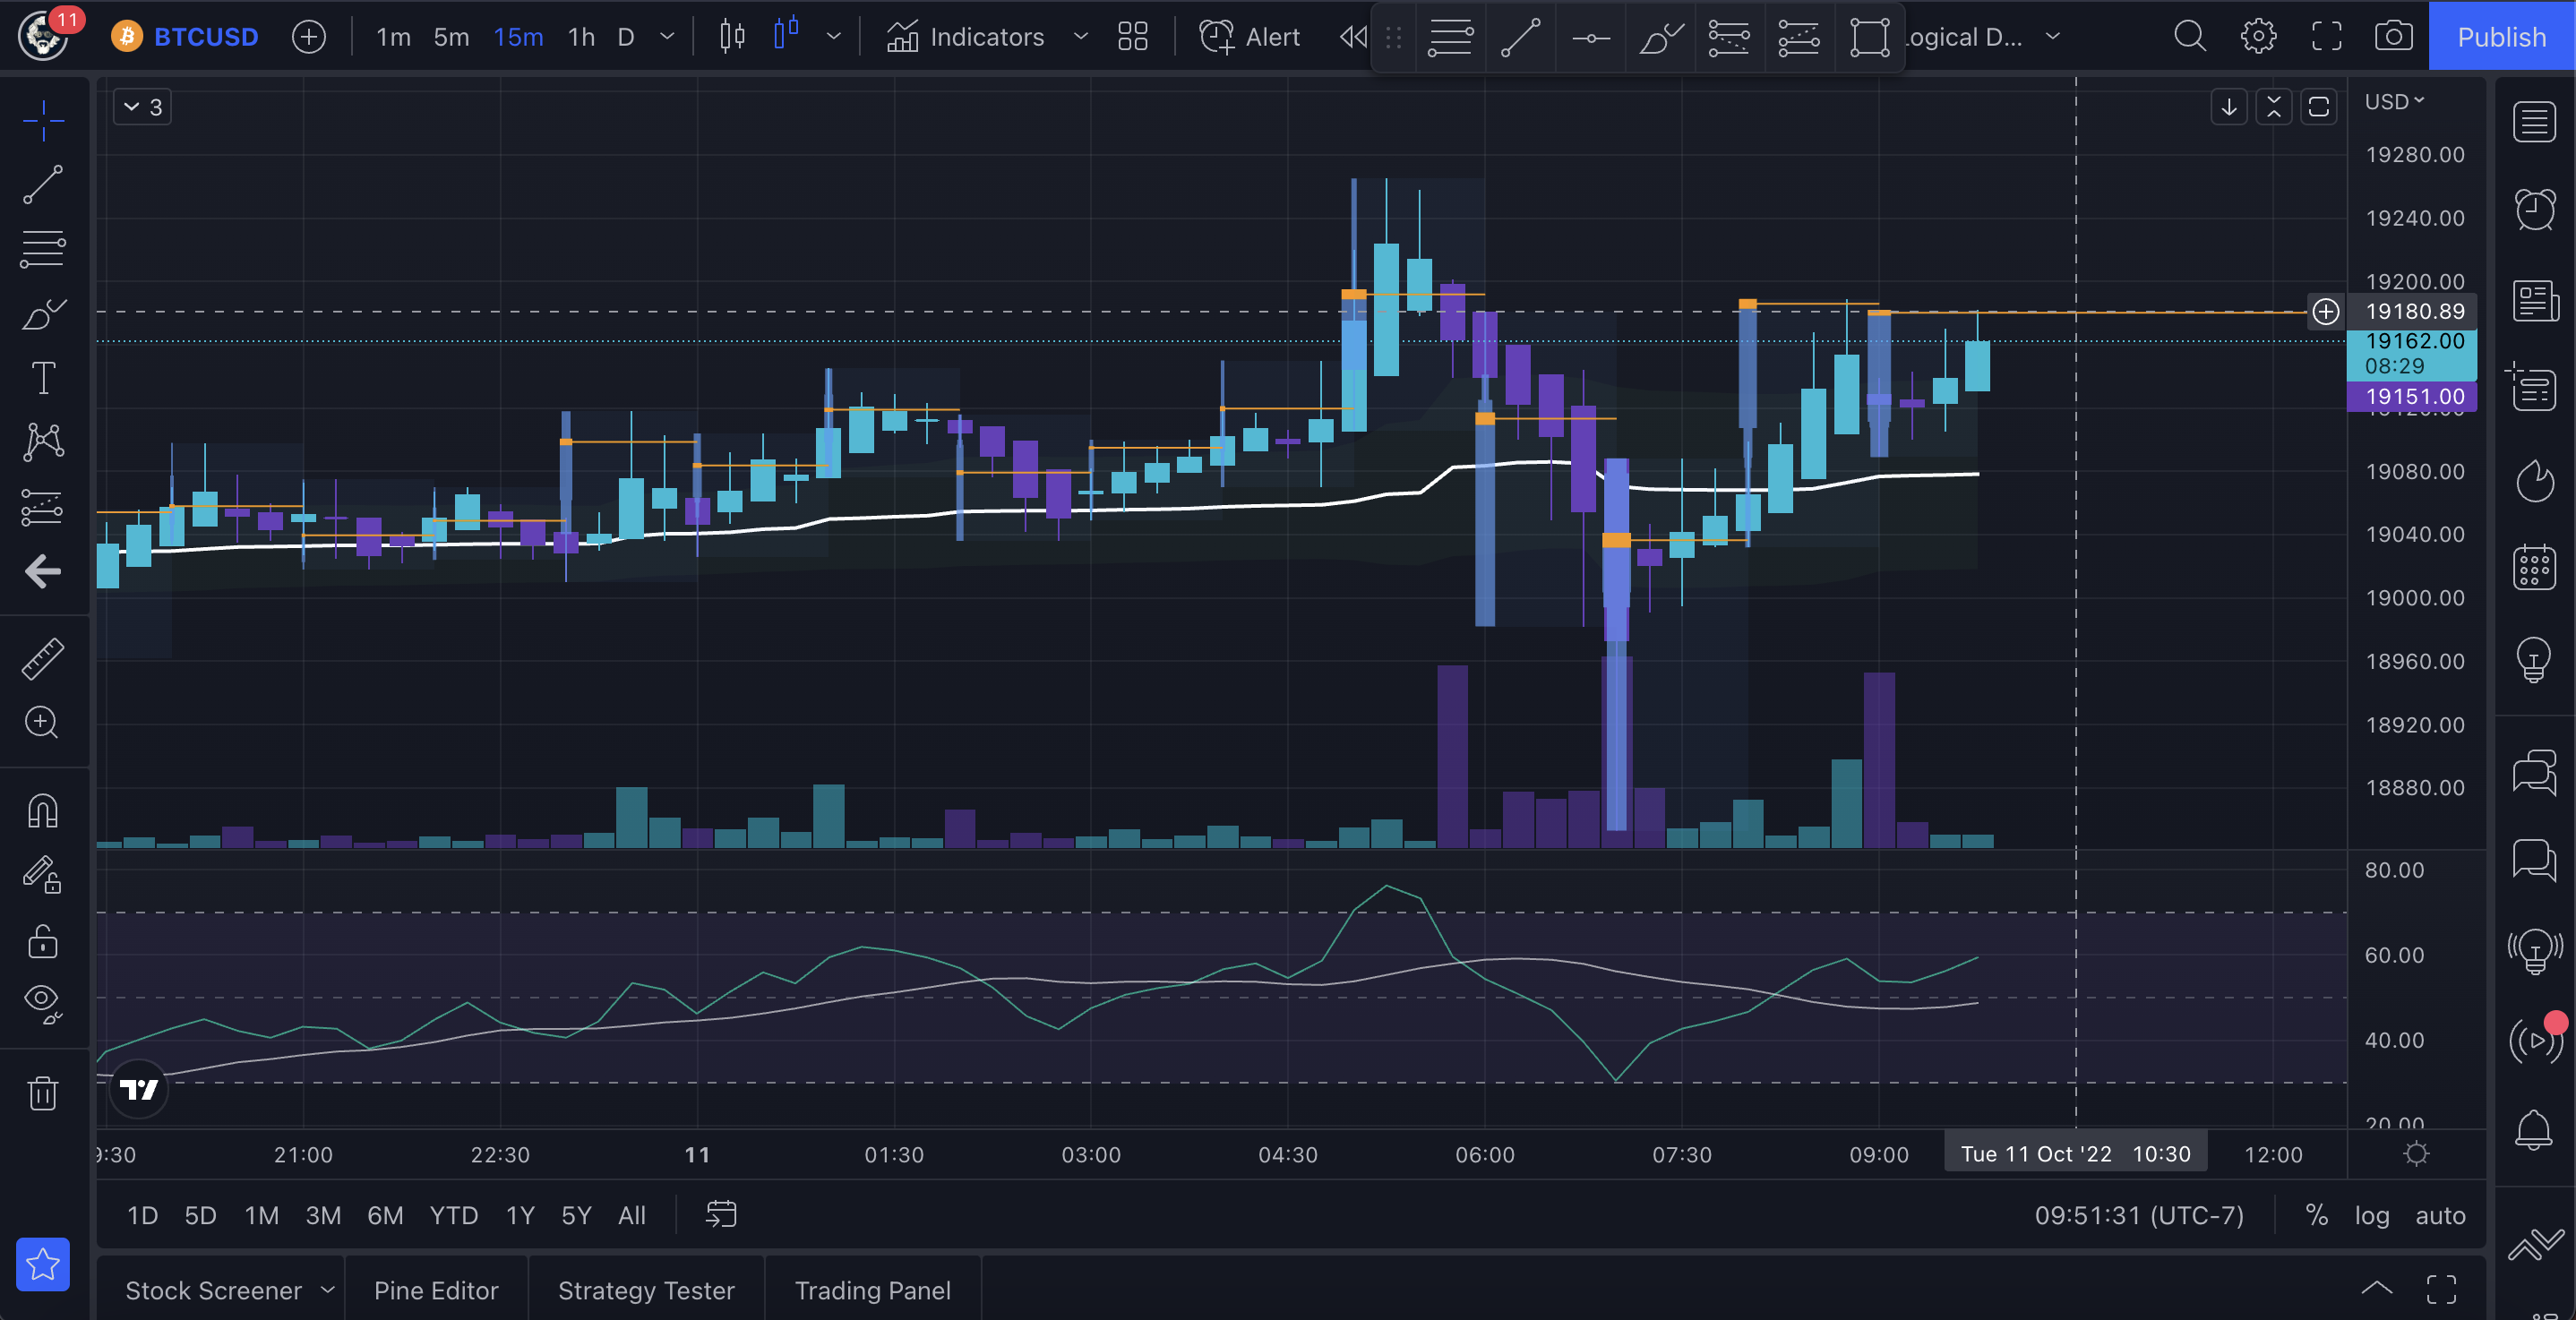
Looking at the 15-minute timeframe, we can see that the price is above the VWAP, or the Volume Weighted Average Price, so we are looking at a short-term uptrend. This could be a bullish sign compared to the higher lows being formed on the higher-term timeframes.
The bullish momentum seems to be slowing up in the short term, which just looks like it will continue in this sideways trend for a bit.
Consolidation Helps Us Practice Patience
When you come across consolidation times in the markets, you get bored and a bit itchy at times, which can lead to taking bad trades. When the price is stalling, that means that the market has found fair value and it will take some serious movements to get it to run one way or the other. As retail traders, we are not the ones to move the markets, so we have to be patient and wait for the big boys to decide to get active. This is when we play into momentum and ride the trend!
If one asset like Bitcoin is stalling and you just have to trade somethign, go look at some other alts that may be moving. This is why I do watch a couple of other blue-chip assets like Ethereum, Litecoin, BNB, ADA, and Solana. These assets have good liquidity markets on the exchange I trade on, plus they tend to trade well at times that Bitcoin could be a bit boring to intraday trade.
The best lesson I have learned in the trading game is not all the different indicators, patterns, etc, that I have learned to read, it is about the lesson in patience that I have learned. Sometimes you have to just let the market make its move and just ride with the current.
Stay calm and trade on everyone, and until next time…
Be Cool, Be Real, and always Abide!

Nothing said is financial advice.
This is for educational and recreational purposes only!
Stay safe in these volatile markets and don’t get rekt!
Follow the markets and get the latest data and news on Coin Logic
Trade with me on Apollo X on BSC
Also posted on my blog on the Hive blockchain via Leofinance.io
https://leofinance.io/@thelogicaldude/drawing-the-line-in-the-sand-for-bitcoin
