
Bitcoin Price Analysis: Correction or Bull Market in the Works?
Well, here we are again, doing some Bitcoin price analysis, just waiting on the price to decide if it wants to correct back to some of these lower volume ranges, or are we going to break the mold and continue higher and kick off the next bull market if we break the 200 day moving average?
Let’s take a look!
Bitcoin Price Analysis: Retesting Previous Price Shelf
If you have not heard of the concept of a price shelf, well, that is when the prices ranges in a tight zone for a period of time. It creates a sort-of shelf if you will, and can be considered either a stepping stone to higher prices, or the top of a local rally.
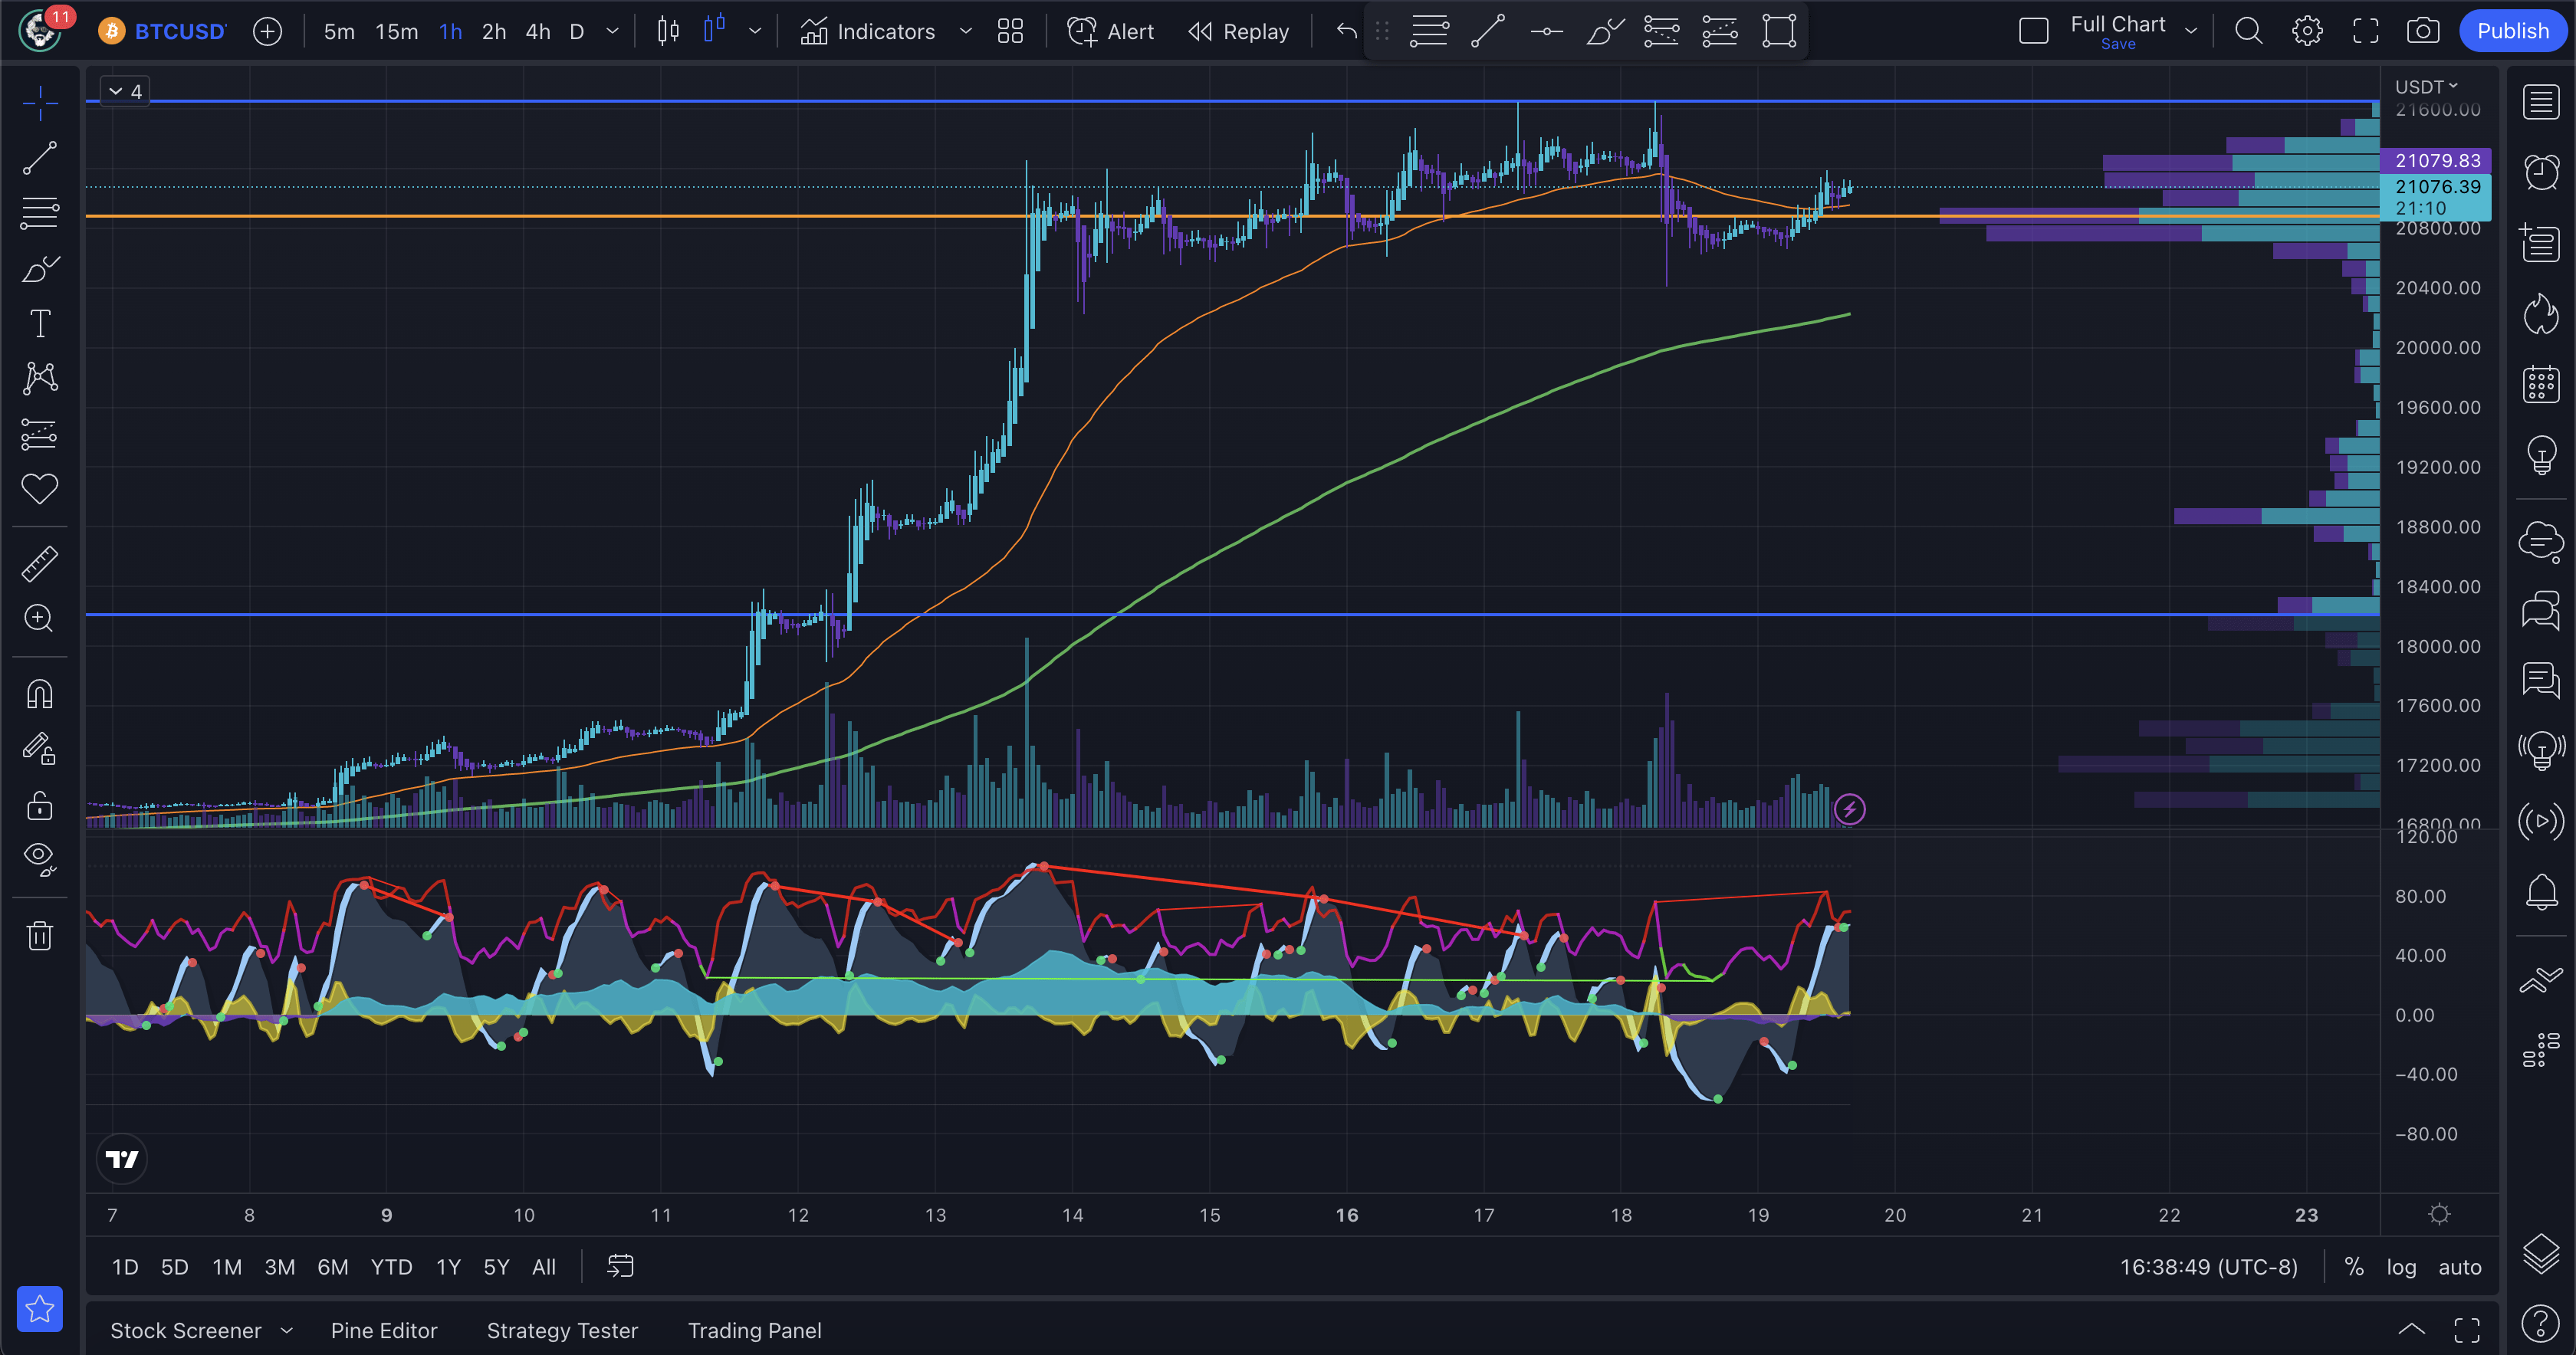
The way Bitcoin looks on the 1 hour time frame as shown in the chart above, it looks like the price is retesting the previous shelf, and is getting rejected from going any higher. This is a bearish sign in the short term.
Bitcoin Price Is Chewing On a High Volume Zone
The Bitcoin price is currently hanging out and ranging between 20,500 and 21,500, give or take a little bit. When looking at the volume profile, which is what shows the amount of volume at certain price levels, you see that we are in what is called a high volume node, or zone. There are a lot of bid and ask orders in this area that are being chewed up right now.
Once the supply at these levels dries up, then we will see where the price heads. The way the momentum indicators and RSI are pointing, we are looking at some downside action pretty soon. This theory is accompanied by the retest of the previous shelf and failing to get above it.
Moving Averages Turning Down On Hourly Time Frames
Now remember, this is the 1 hour time frame, but other times also confirm. The daily time frame is still looking bullish for the time being, so the correction is either incoming and not going to be too bad, or this whole thing is turning from a bull to a bear trap… The possibilities are endless in these crazy markets.
Daily Still Bullish For Now
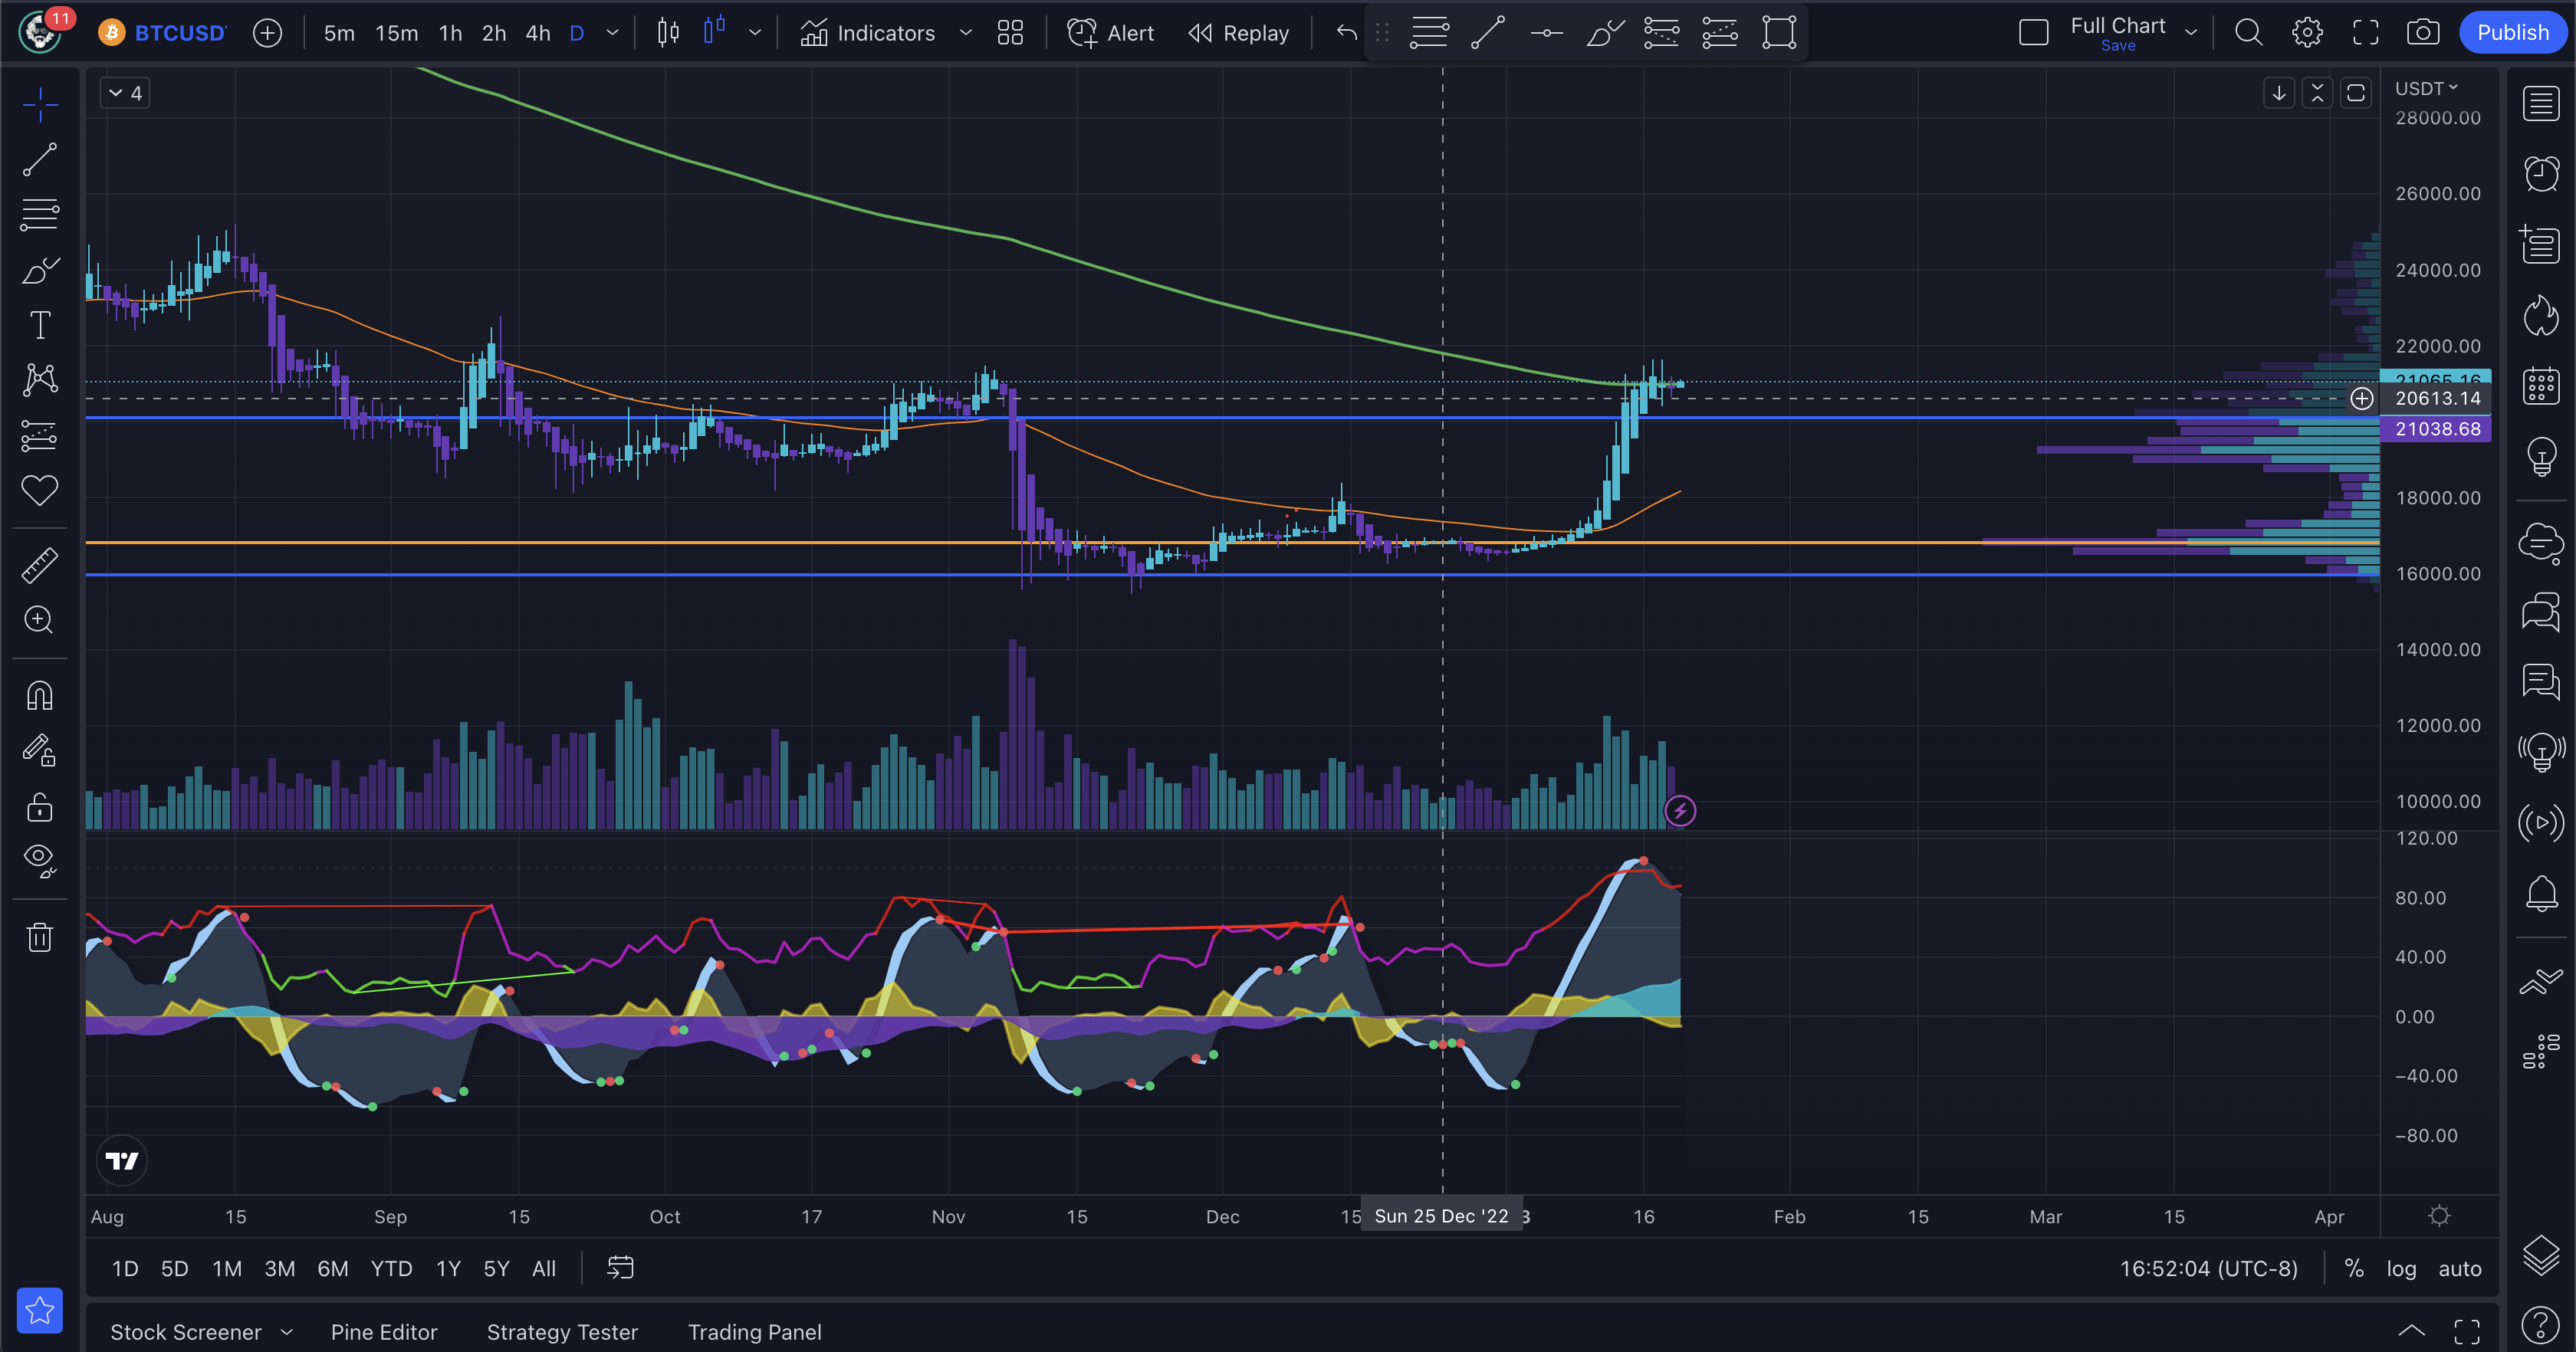
The daily time frame tells a bit different story. What we are seeing here is that the price is right at the 200 Day moving average. This is a huge zone of support and resistance that we have to contend with. It appears that we are being rejected by the 200 Day MA and we could see some downside, but just how much downside?
I would like to see a retest of the 50 Day MA the then a continuation and full break out of the 200 Day. That will be some serious bull season at that point in time. Then when that 50 Day MA crosses over the 200 Day MA, well, just hold on to your hats boys and girls, because we are going for a ride!
If you like my Bitcoin price analysis, then please share this post and let’s grow the Coin Logic community together!

Nothing said is financial advice.
This is for educational and recreational purposes only!
Stay safe in these volatile markets and don’t get rekt!
Follow the markets and get the latest data and news on Coin Logic
Any videos will be posted to Coin Logic TV on YouTube in addition to 3Speak:
https://www.youtube.com/coinlogictv
Upgrade to a paid Tradingview account and get more charts, indicators, screens and more!
Trade stocks, options, and cryptocurrency with us on Robinhood and pay no commissions! Use our link to sign up, link your account, and get a free stock!
Trade with us on Apollo X on BSC if you want to trade crypto with leverage in a decentralized fashion!