How To Really Use The RSI – You’ve Probably Been Doing It Wrong
If you have been trading or at least studying how to trade for any length of time, you have heard of the RSI or the Relative Strength Index. It’s one of the core indicators that most traders use. But, most traders use it incorrectly.
Most traders look at the RSI as a way to tell if the market is overbought or oversold. The idea is, that when the market is hot and in the overbought range, it’s time to sell. When it is cold and oversold, it’s time to buy. At least that is what many of these ‘guru’s out here will tell you. But the RSI is so much more than an overbought or oversold indicator.
What Is The RSI?
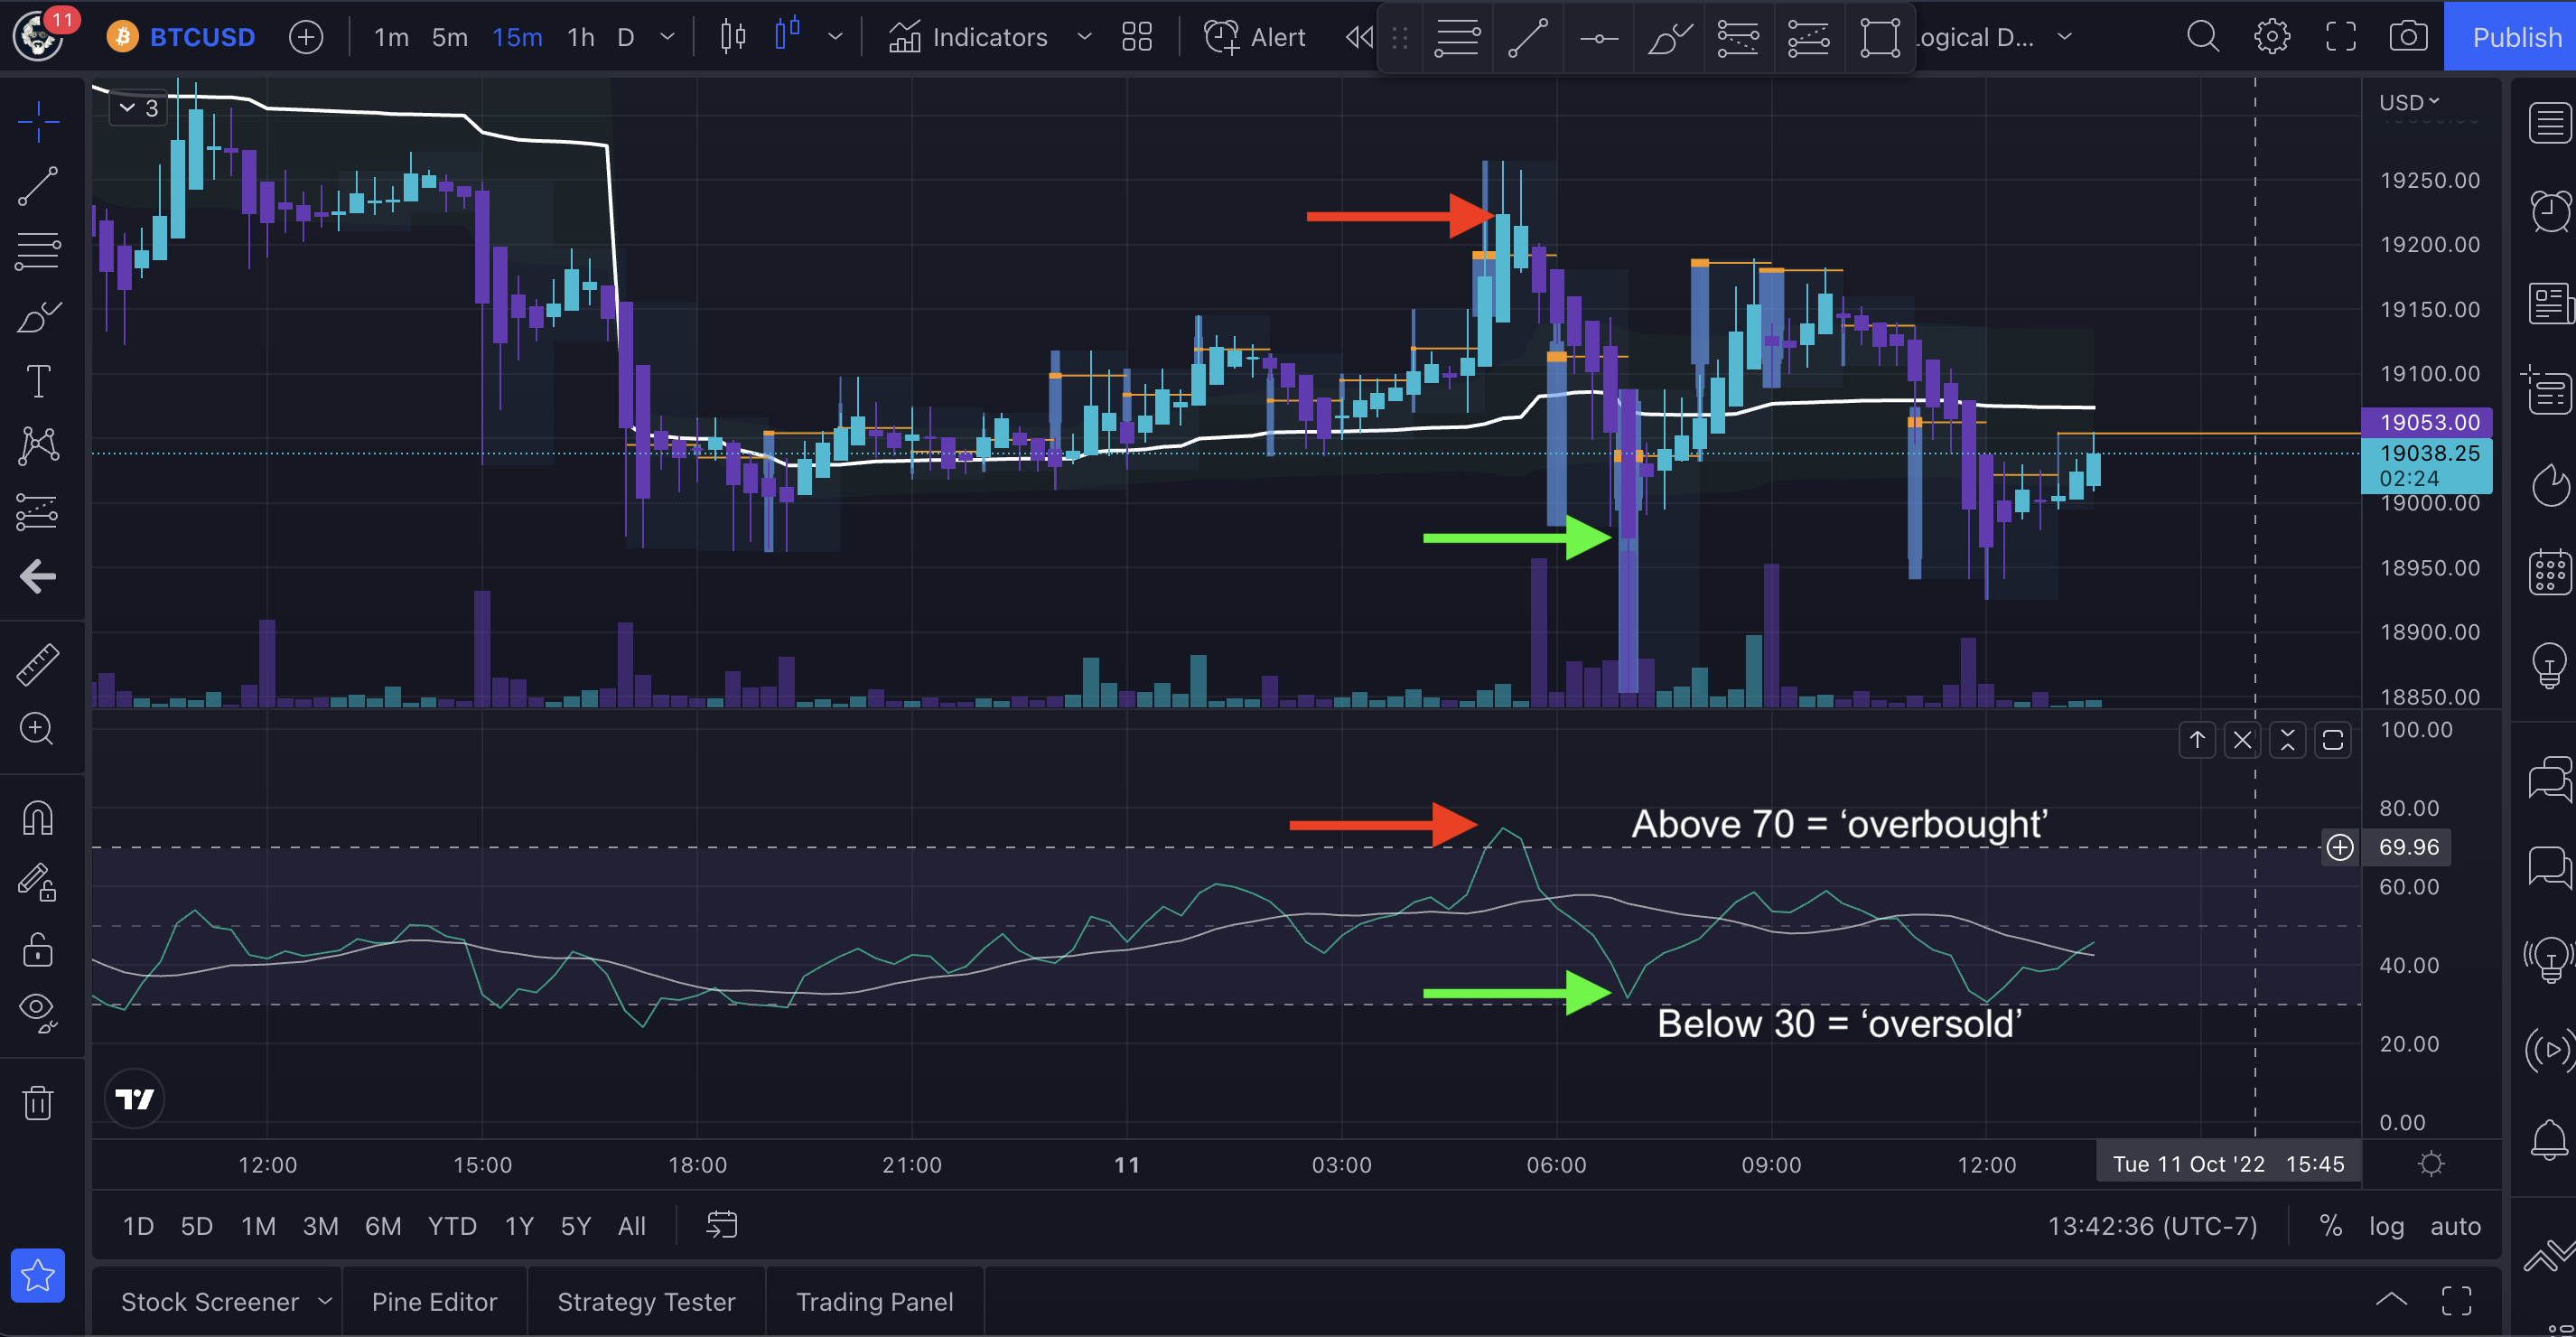
First, to know how to properly use the RSI, you need to understand what it is. The Relative Strength Index is a momentum-based indicator that measures the speed and strength in the volume of an asset’s price changes over a period of time. The RSI is a lagging indicator which means it is behind the price movements so it is also used to spot trends and trend changes.
The RSI ranges from 0-100. The 70 level is where it is considered overbought, and the 30 line is considered oversold. Many times the price will reverse near these levels, so many traders use it as one of the main indicators for their entries and exits. What many traders tend to overlook are the moves that are made in between those levels.
When you get big spikes up or down, that generally indicates a high volume move which is attempting to push the price. This happens when traders are hitting the bid or the asking price, meaning they are buying or selling into the market, pushing the price one way or the other. The RSI shows how strong those moves are.
Bullish or Bearish
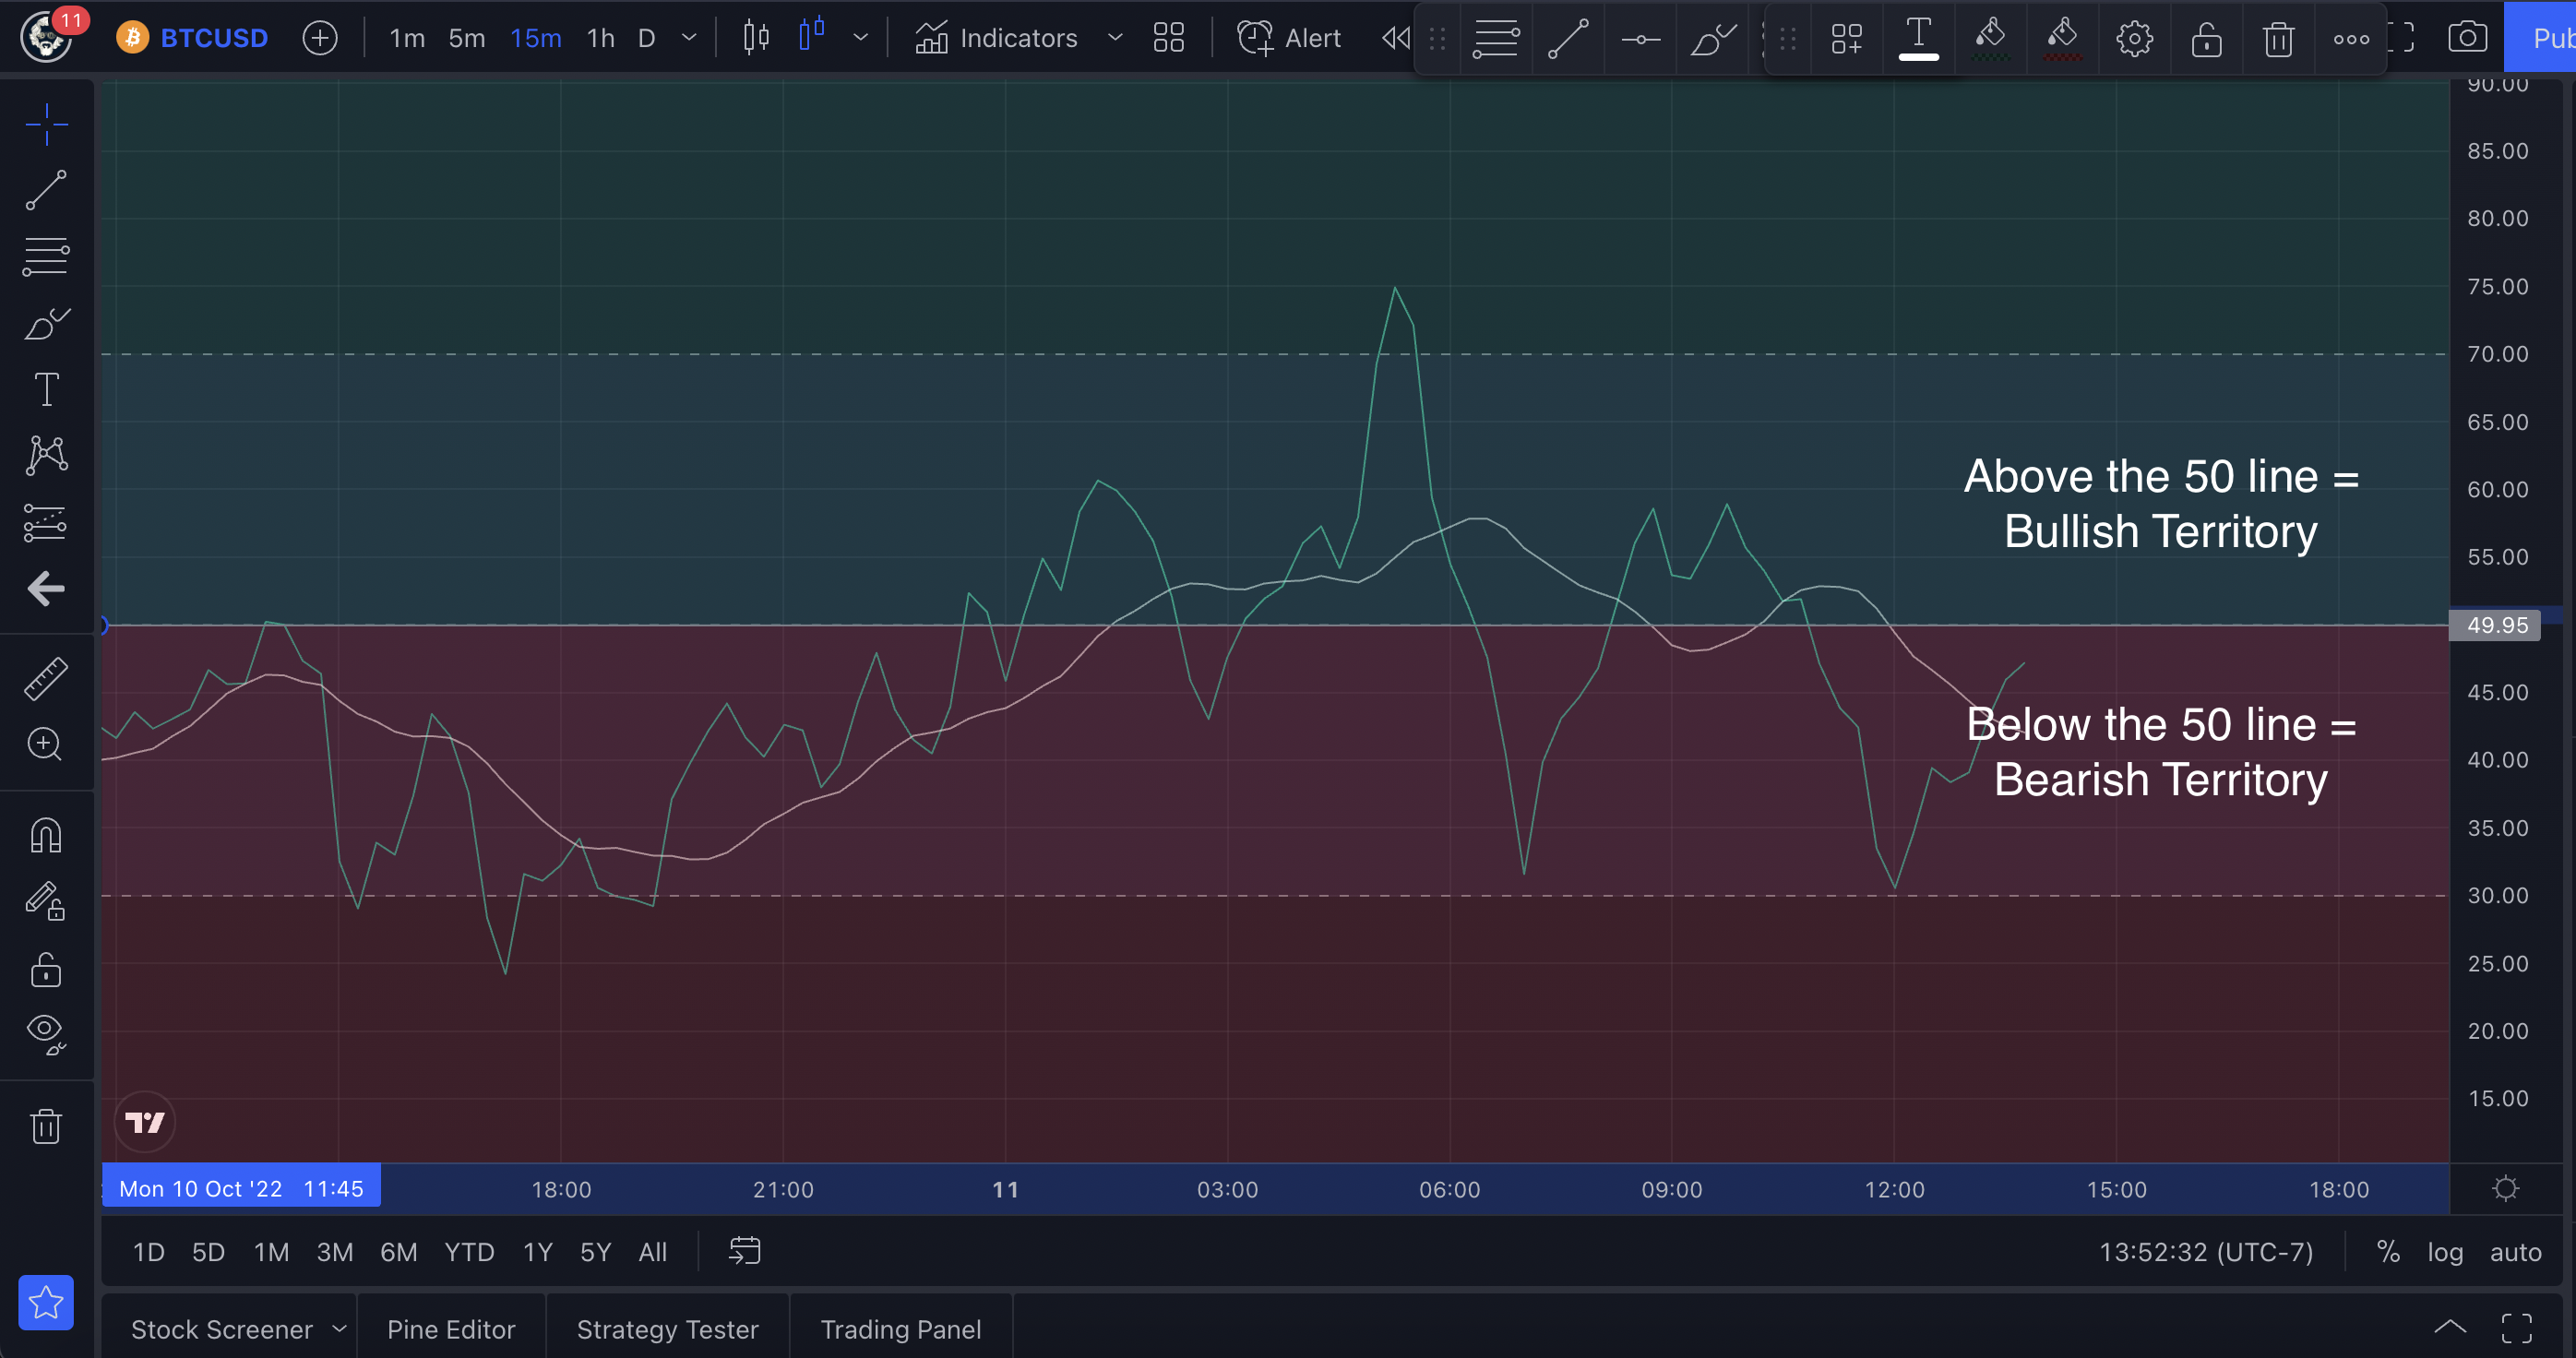
The RSI spends a lot of its time making moves in the middle of the 70 and 30 ranges, so that’s what I mean about looking for those moves in between the levels.
Many traders completely overlook the 50 line of the RSI. This line is the line in the sand to be able to tell if the market is in a bullish or bearish move and let you catch moves that may not reach those 70/30 levels. Above the 50 line, you are looking at bullish territory. This means that the market is likely moving in an upward trend or moving with upward momentum. Below the 50 line, and you are more in bearish territory. This is a good way to judge the direction of your trade.
A sharp spike to the overbought level doesn’t mean your uptrend is finished and it’s time to get out. That just means the market is hot and there is a lot of buying going on. Many traders will take a profit or enter a short at overbought levels, and then the price keeps moving and you end up missing out on gains on a long or getting stopped out of your short.
When you start to see it top out and turn to the downside, that is time to be looking for a trend reversal but not necessarily making your move just yet. If you are in a long trade it’s time to look for profits, or looking for entry points on a short trade going the other way. Same principle for the oversold range, just the opposite.
It is also good to be patient because the momentum can stay hot or cold for some time, so you want to make sure you are confirming the trend change before you make your move. It can also play around and not even touch either of those levels for a long time. So it’s best to just pay attention to whether or not the RSI is still running above or below the 50 line, that is your trend confirmation.
Using The RSI To Confirm Trends
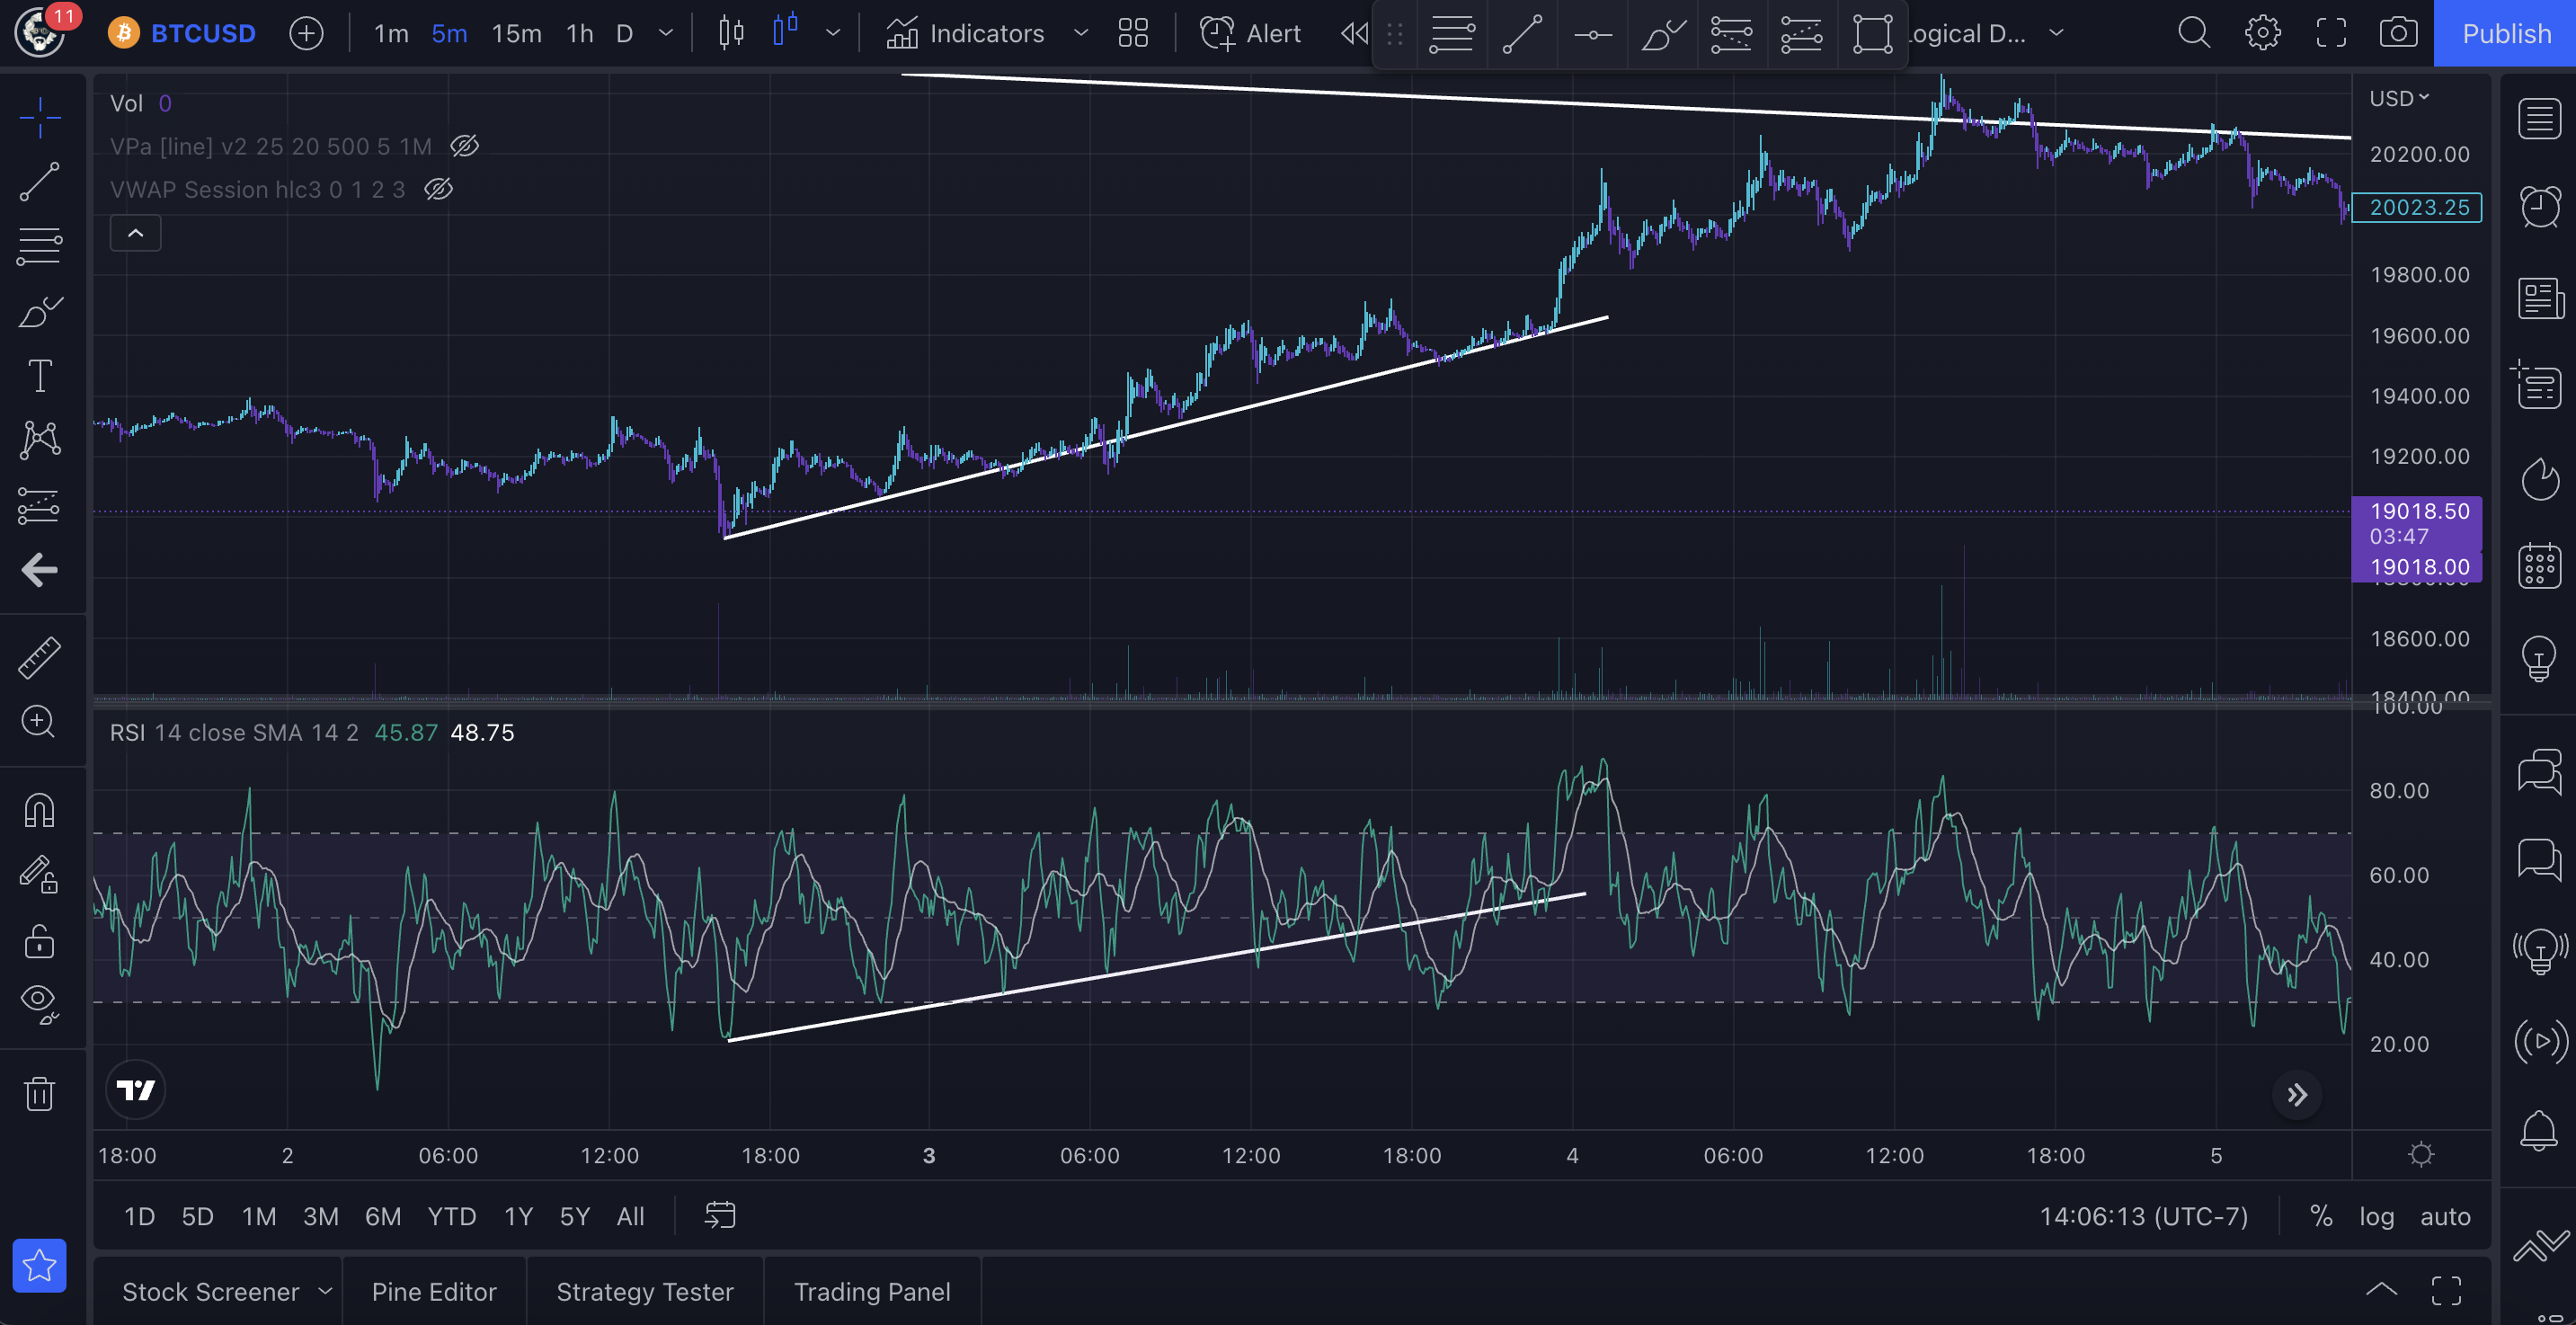
The RSI can be used as a great indicator to find trend changes. Some traders believe that just because the RSI goes into oversold territory, it’s time to go long. But what you have to do is be patient and wait for the trend to fully change. A drop into oversold land could be just an indication that the trend is going south and to be ready to find bottom at some point in the future.
It can bounce around just like price can, so you need to look at patterns. If you see the price and RSI start to print higher highs and higher lows, then you know that the move is going long and you need to ride that wave.
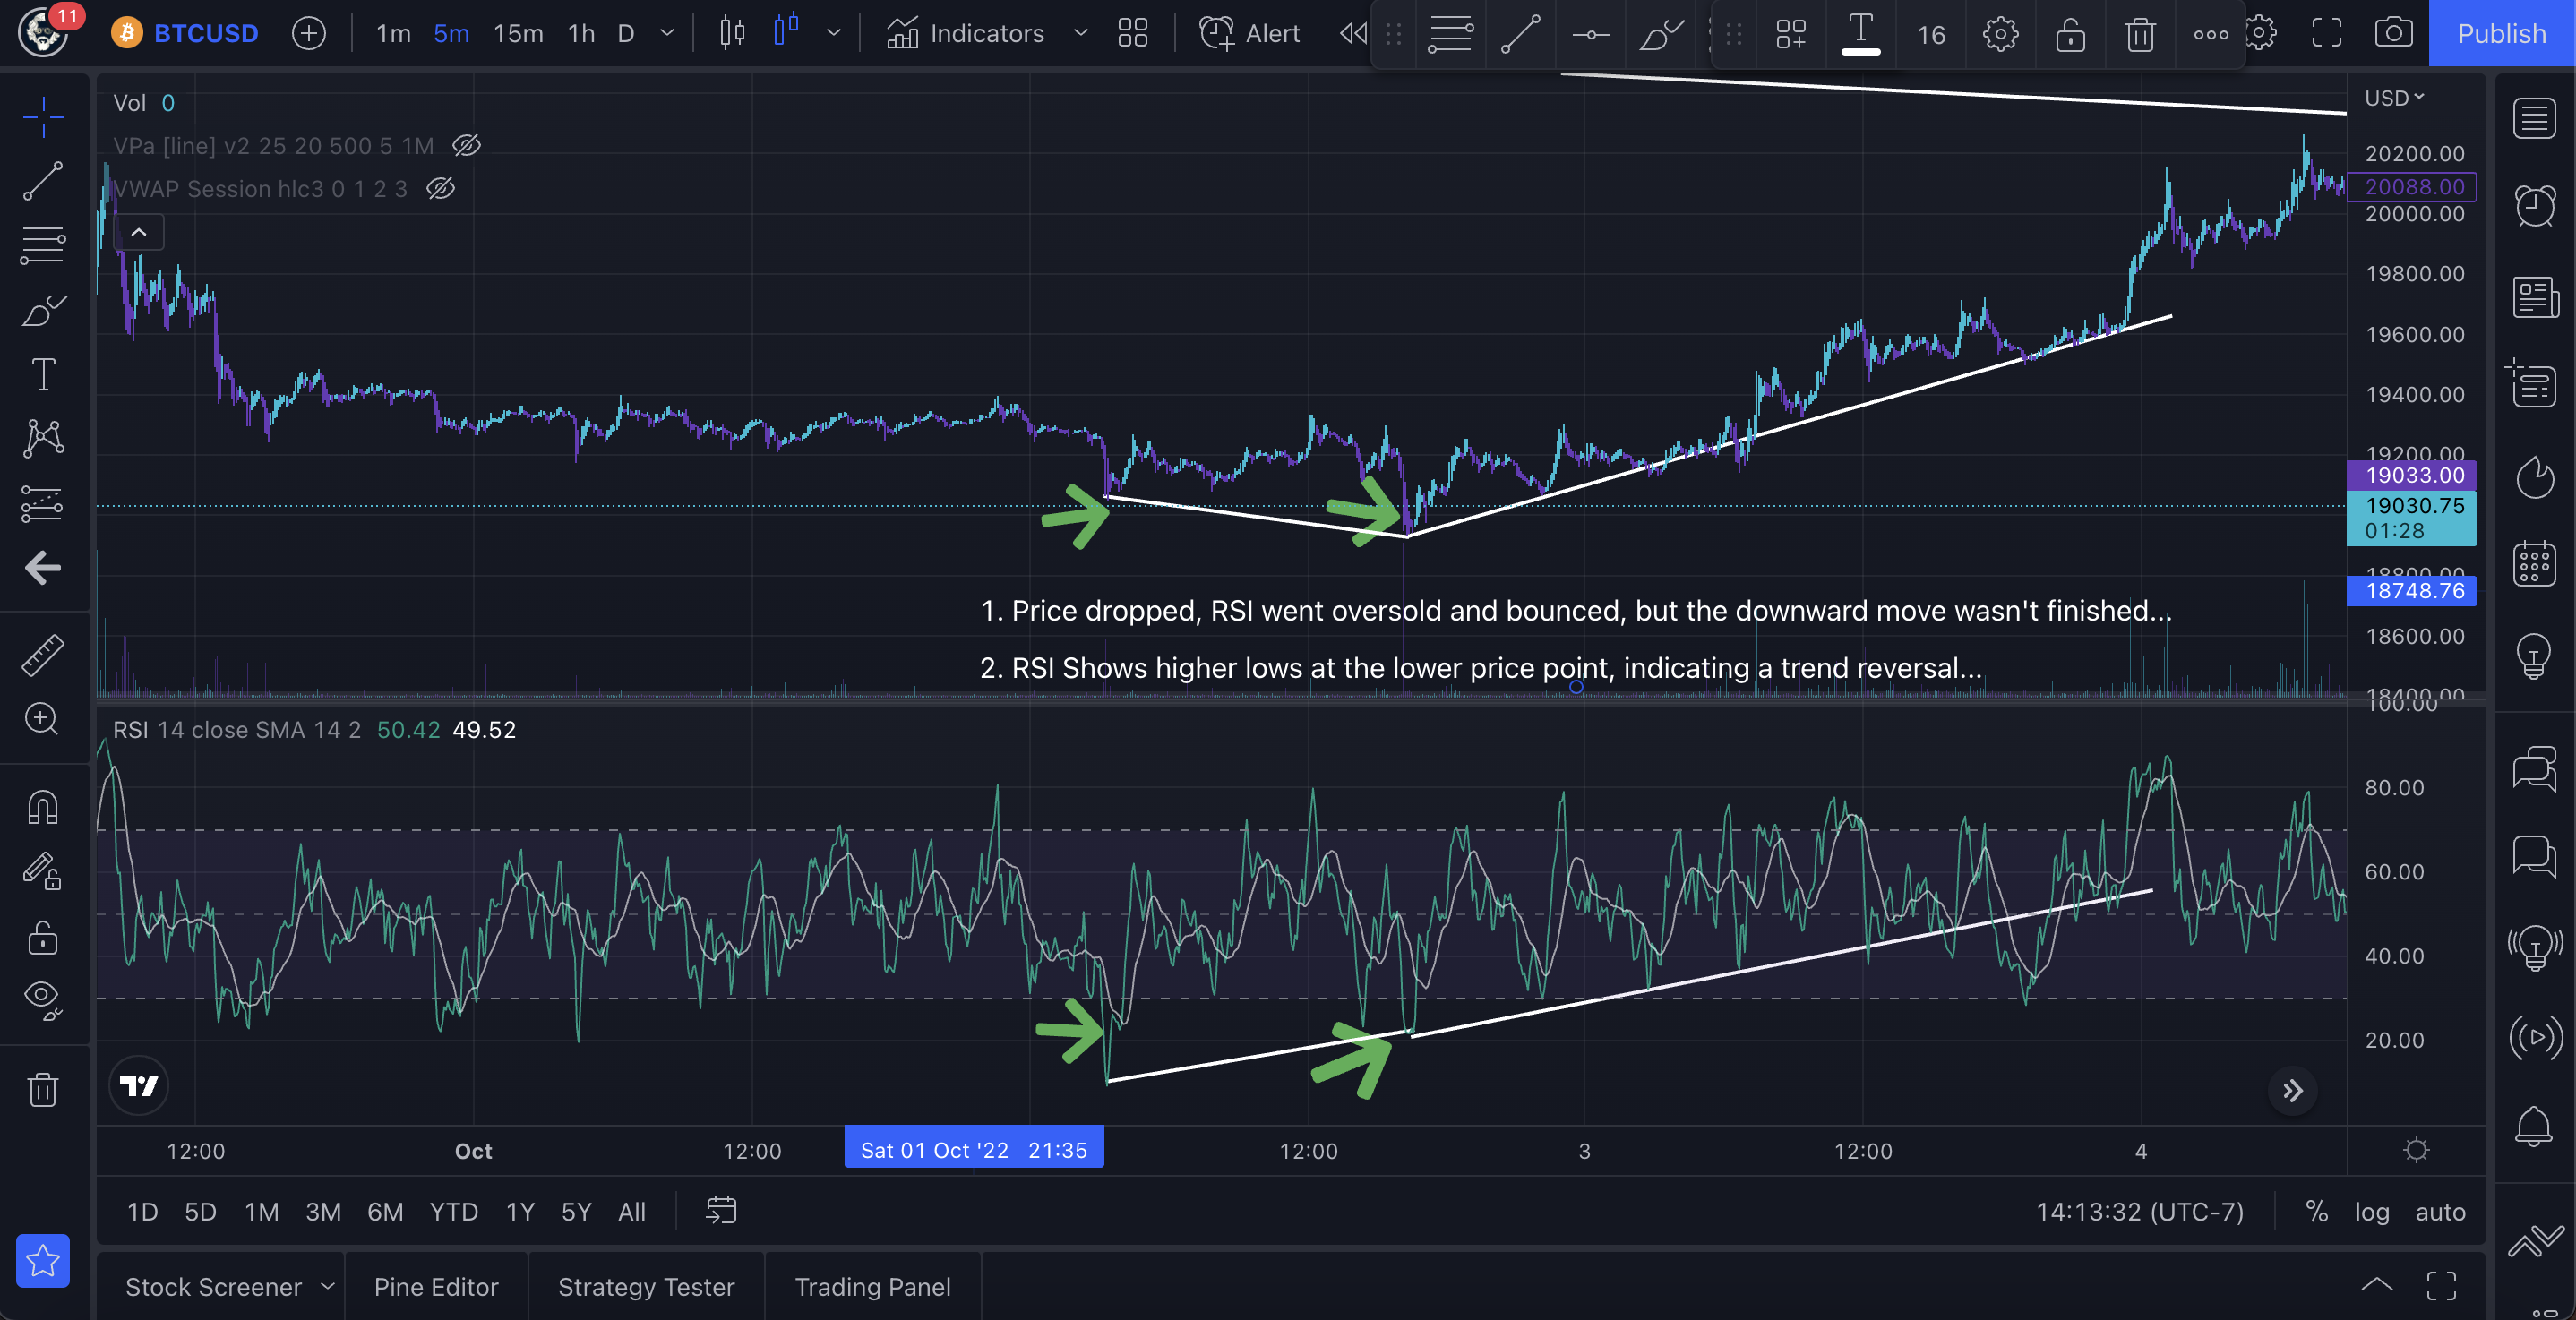
You can see in this example how the RSI went into oversold territory, bounced a bit, but still continued to the downside. So you can’t always go long right at the time it goes oversold. The oversold line is great for setting alerts to let you know something is happening and you need to be paying attention. It can stay overbought and oversold for some time, and if you hit the wrong entry points, you can get stopped out of the trade prematurely.
Looking at the RSI this way will also help you spot changes in the trend so you will know when the right time is to go long. The RSI showing higher lows along with price is confirming the uptrend is in effect.
Spotting Divergence
Divergence in the price and the RSI is an essential skill set to learn in trading. Being able to spot divergence in the momentum and the price action is a solid way to spot an upcoming trend reversal.
Divergence works both ways, bearish and bullish. When you see the price making higher highs and higher lows, but your RSI is making lower highs and lower lows, that is bearish divergence and you need to be looking for a change in trend to the downside.
Same goes the other way… Let’s look at an example…
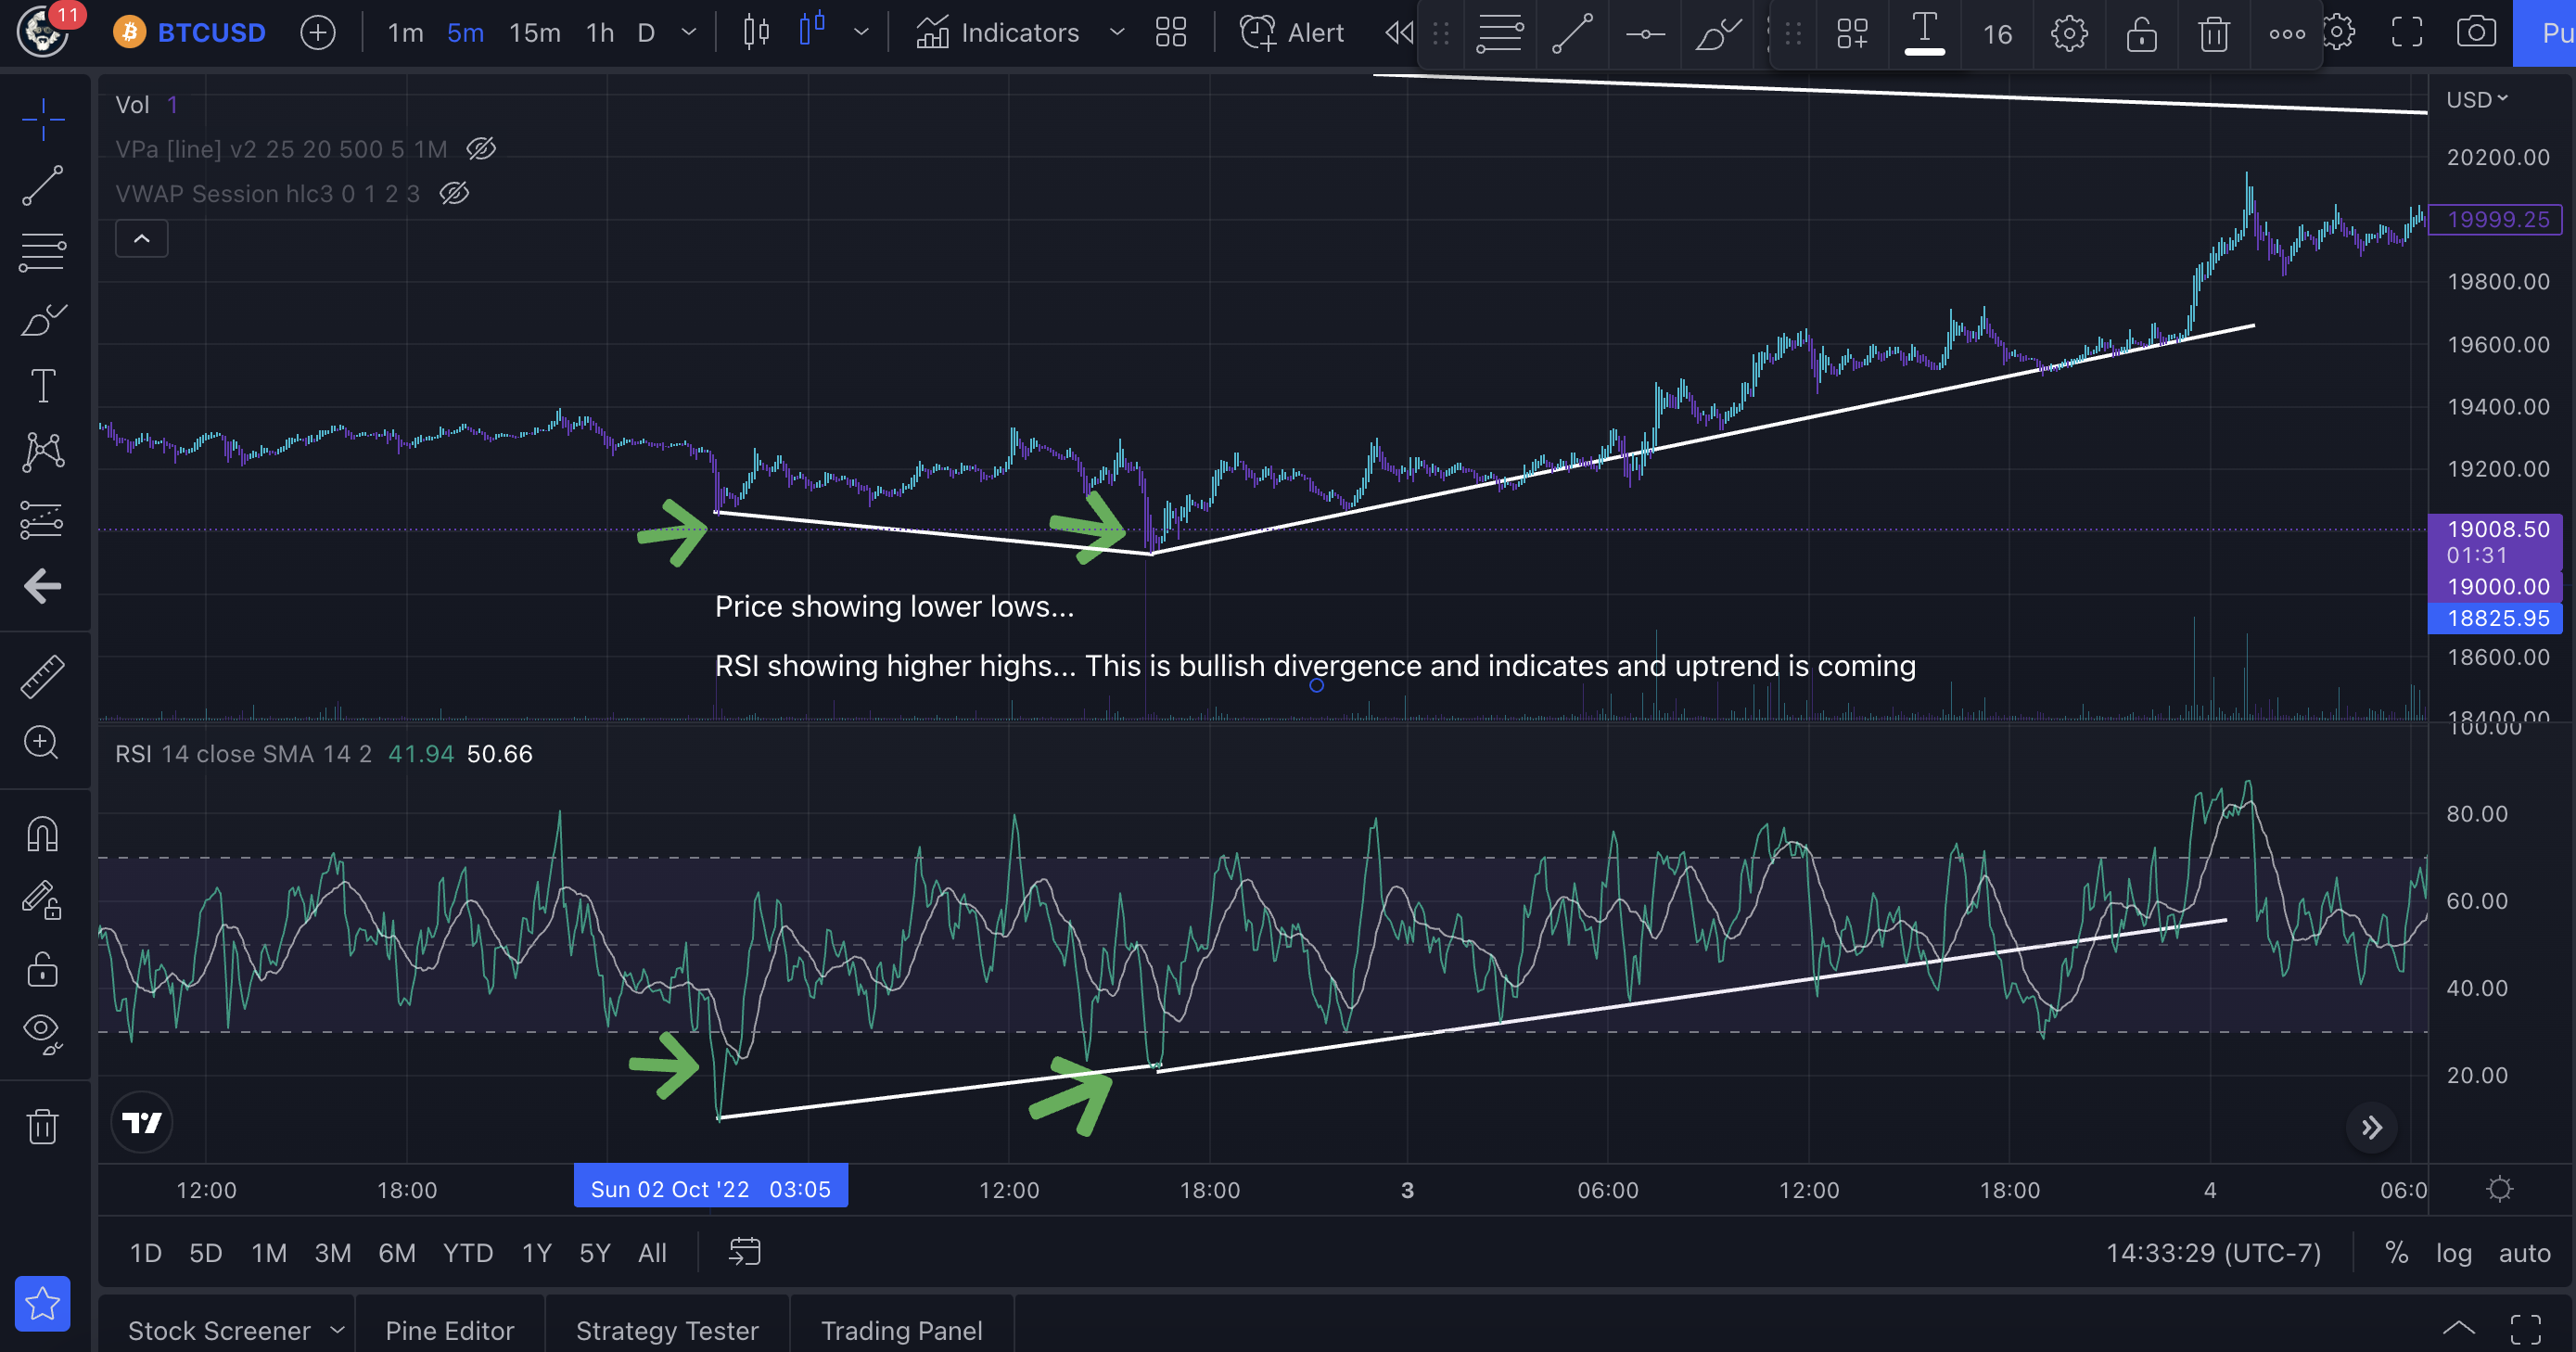
Here you can see that the price dipped down and the RSI went deep into oversold land. But then as price consolidated, it ended up breaking lower and creating a lower low, while at the same time the RSI printed a higher low. This shows that there was more buying happening in this area and we need to be looking for a trend change, which inevitably happened.
Trade Momentum and Ride The Trend Waves
As you see, the RSI is a powerful tool to use to be able to find and trade on momentum moves and ride trend waves in the market. Strong momentum moves, either way, indicate strong price action, so being able to pick up on that momentum, spot signs of trend reversals, and follow the whales on the next trend wave is the best way for retail traders to achieve victory in the markets.
If you are reading this, it’s most likely you don’t have the funds to move the price of Bitcoin or Ethereum, so the best thing you can do is learn to spot what the whales are doing and ride those waves! Use the RSI to help you spot those moves, and above all, remember to be PATIENT and let the move confirm itself, so you don’t wreck yourself!
Hope this lesson in the RSI that I have learned over my time in the markets helps you on your trading journey.
Until next time traders…
Be Cool, Be Real, and always Abide!

Nothing said is financial advice.
This is for educational and recreational purposes only!
Stay safe in these volatile markets and don’t get rekt!
Follow the markets and get the latest data and news on Coin Logic
Trade with me on Apollo X on BSC
Also posted on my blog on the Hive blockchain via Leofinance.io:
https://leofinance.io/@thelogicaldude/how-to-really-use-the-rsi-you-ve-probably-been-doing-it-wrong
