
Watching For Reversal Candles
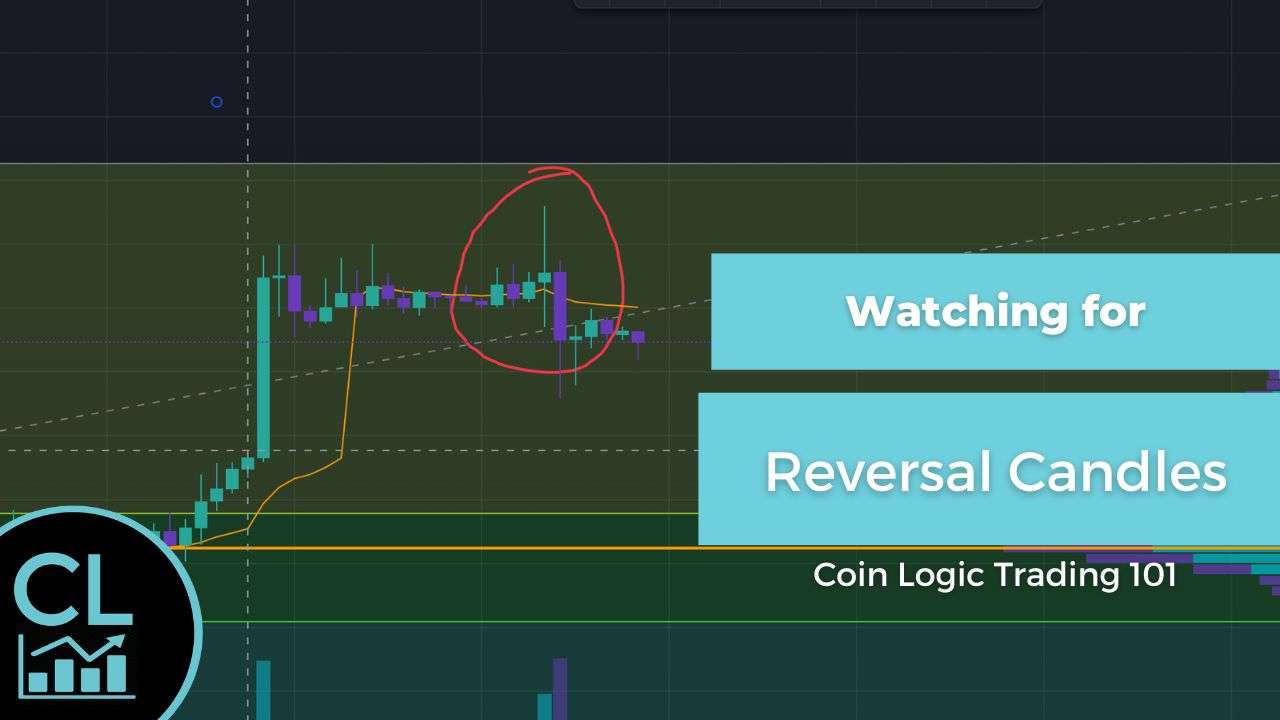
Watching reversal candles are a great way to see if the market is getting ready to move in the opposite direction. As with any market indicator, nothing is one hundred percent, but long-wick candles are a pretty solid indicator that the market has reached its height and is looking to recorrect.
Reversal candles or long-wick candles happen when the market tries to push the price in a certain direction, but gets exhausted. Either there are no longer a number of buyers trying to buy at a certain price, or the sellers run out of assets to sell at the demand prices.
The market is just a big auction. It’s all based on supply and demand. So when the market runs out of buyers at a certain price, the market has to adjust and come back to where there are people willing to buy an asset. Many times in a trend, either up or down, when a support or resistance zone is established, the price will many times shoot up or down then reverse very quickly. This means that the side controlling the price movement up or down has exhausted it’s attempt to move the price, this is when it moves the other way.
Doji Candles
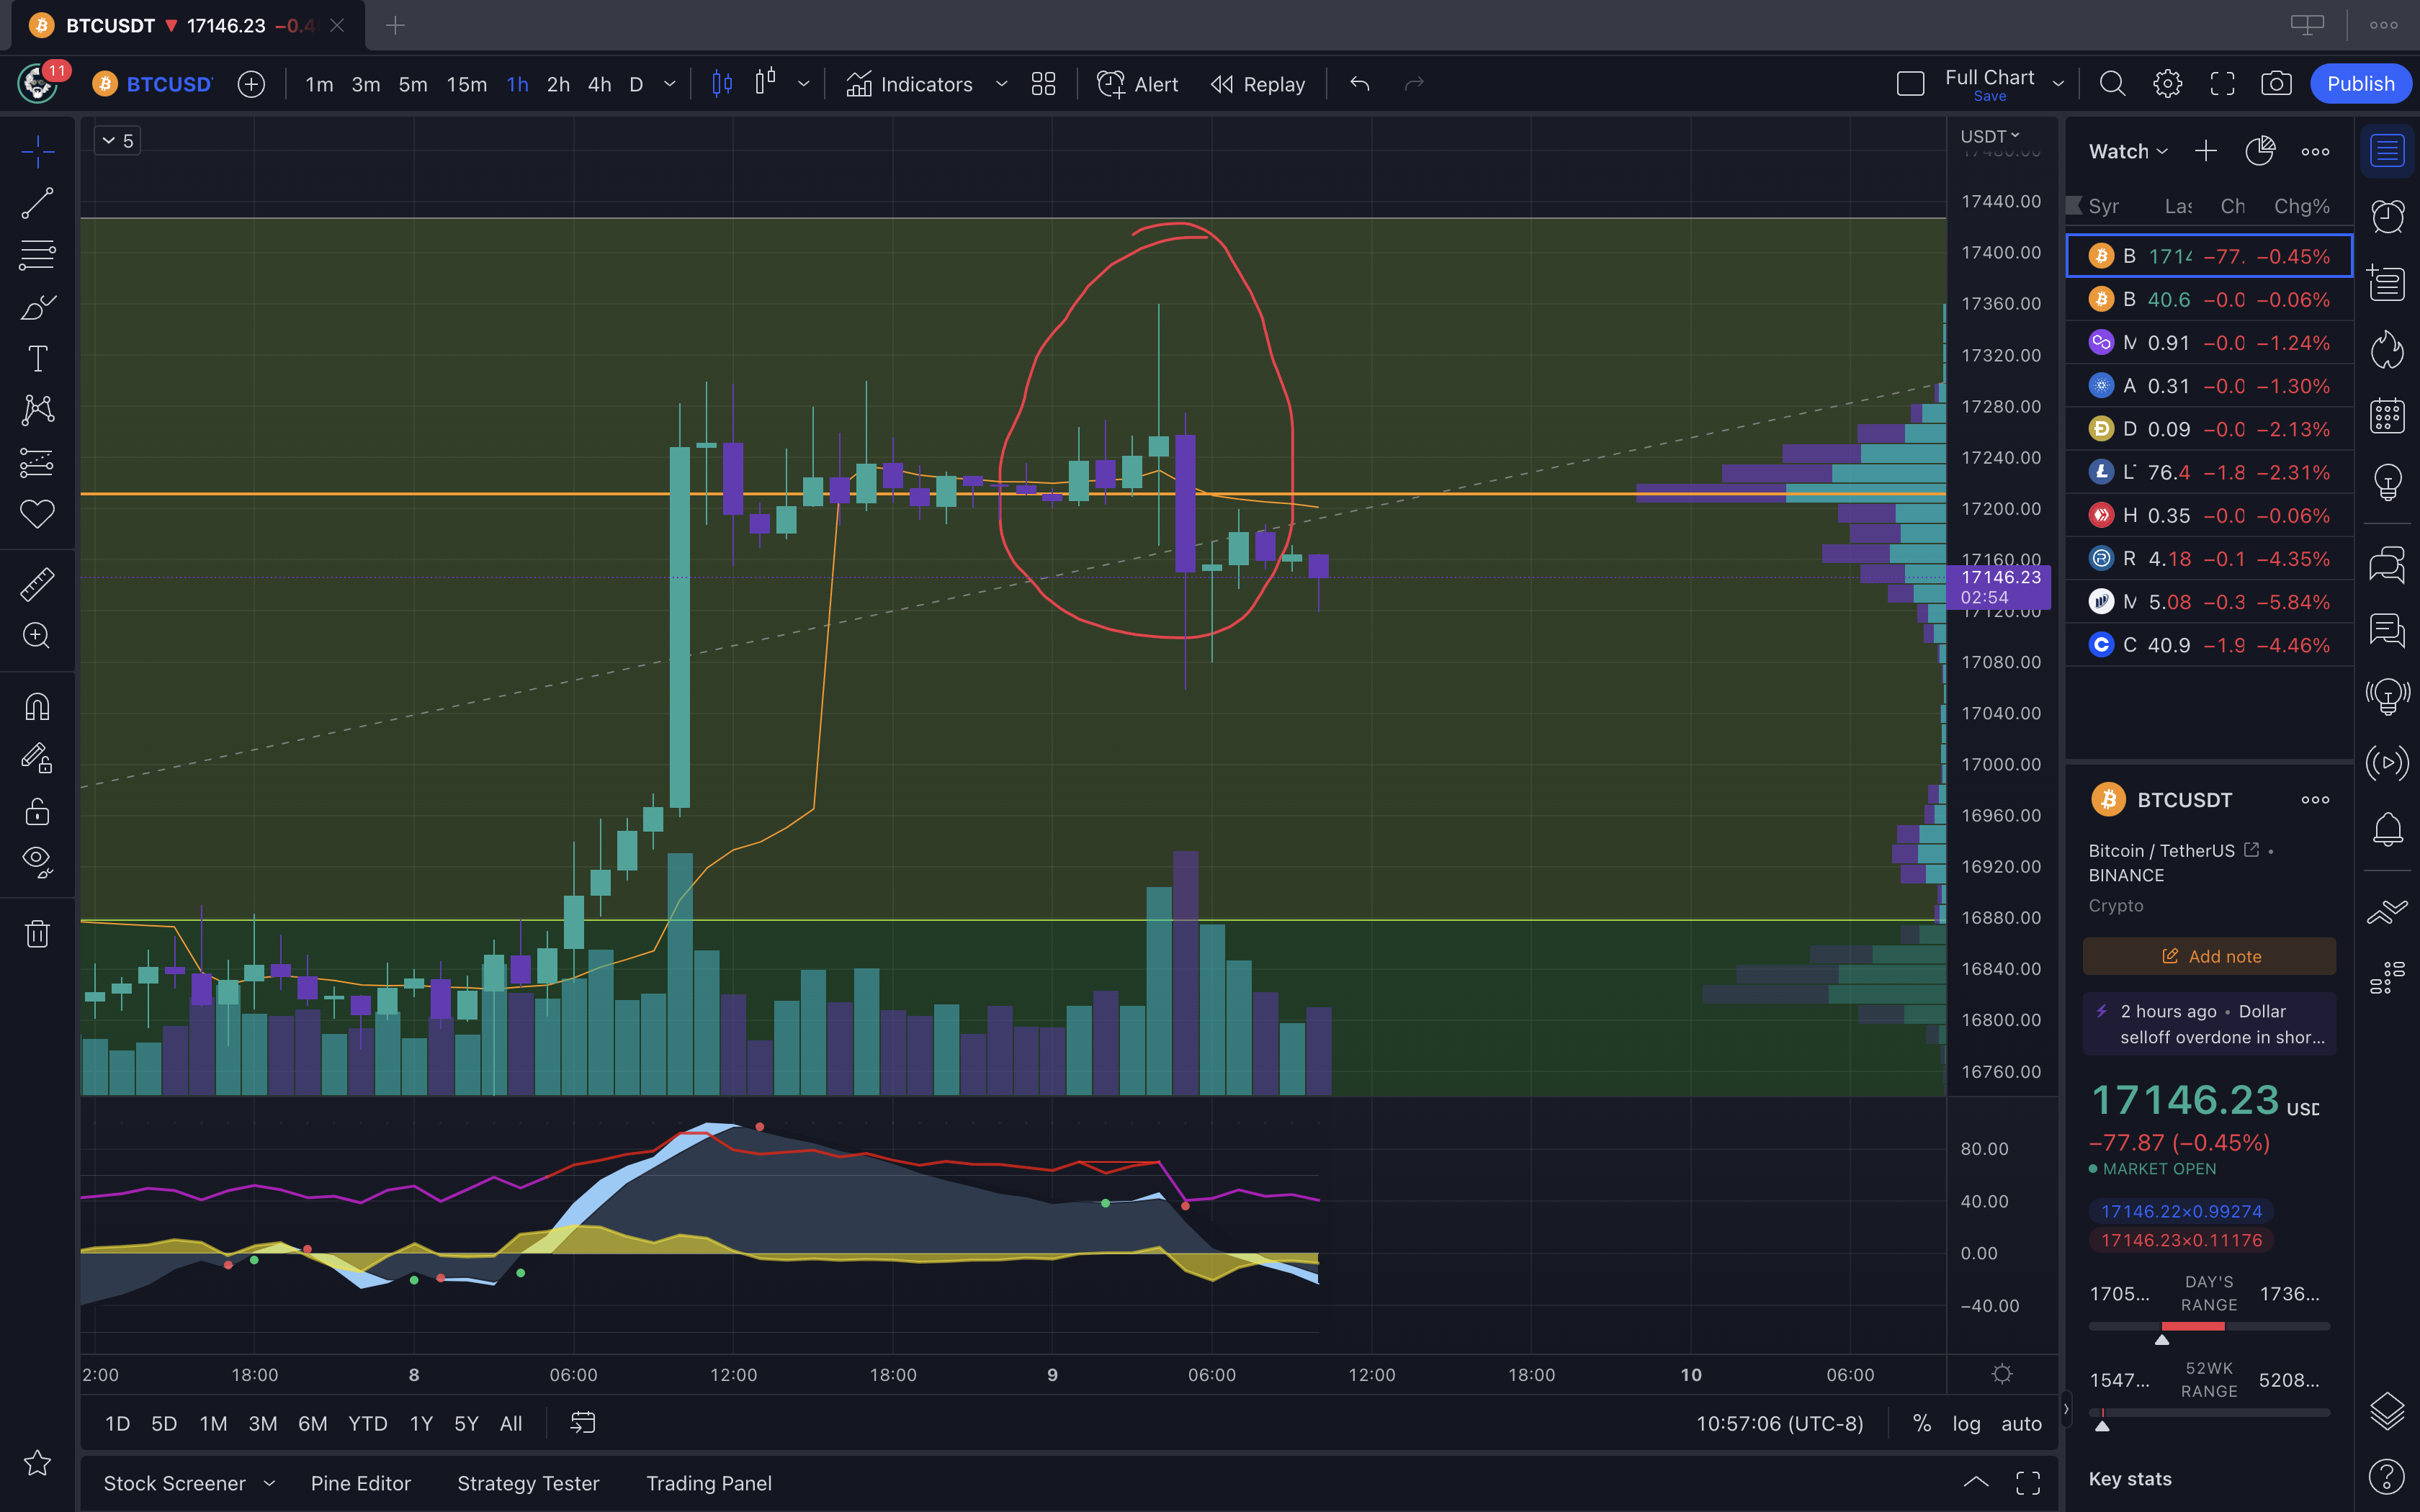
In this example, you can see that price broke and run up, then dropped back down to an extreme level and settled in the middle with a small candle body. This is a long wick doji candle. Many times when you see this, the probability of the price action moving in the other direction is in the future.
You see that after the doji candle, the market moved in a bearish trend then bounced and came back to find resistance at the base of the doji candle body. The continuation down shows the weakness in the trend so a short trade could be in play.
Absorbing Candles
This may not be an industry term, but at Coin Logic, we often call long-wick candles, absorbing candles. This is when the buy or sell orders get absorbed at the top or bottom of the market and either reverse or at the very least, go into a consolidation mode.
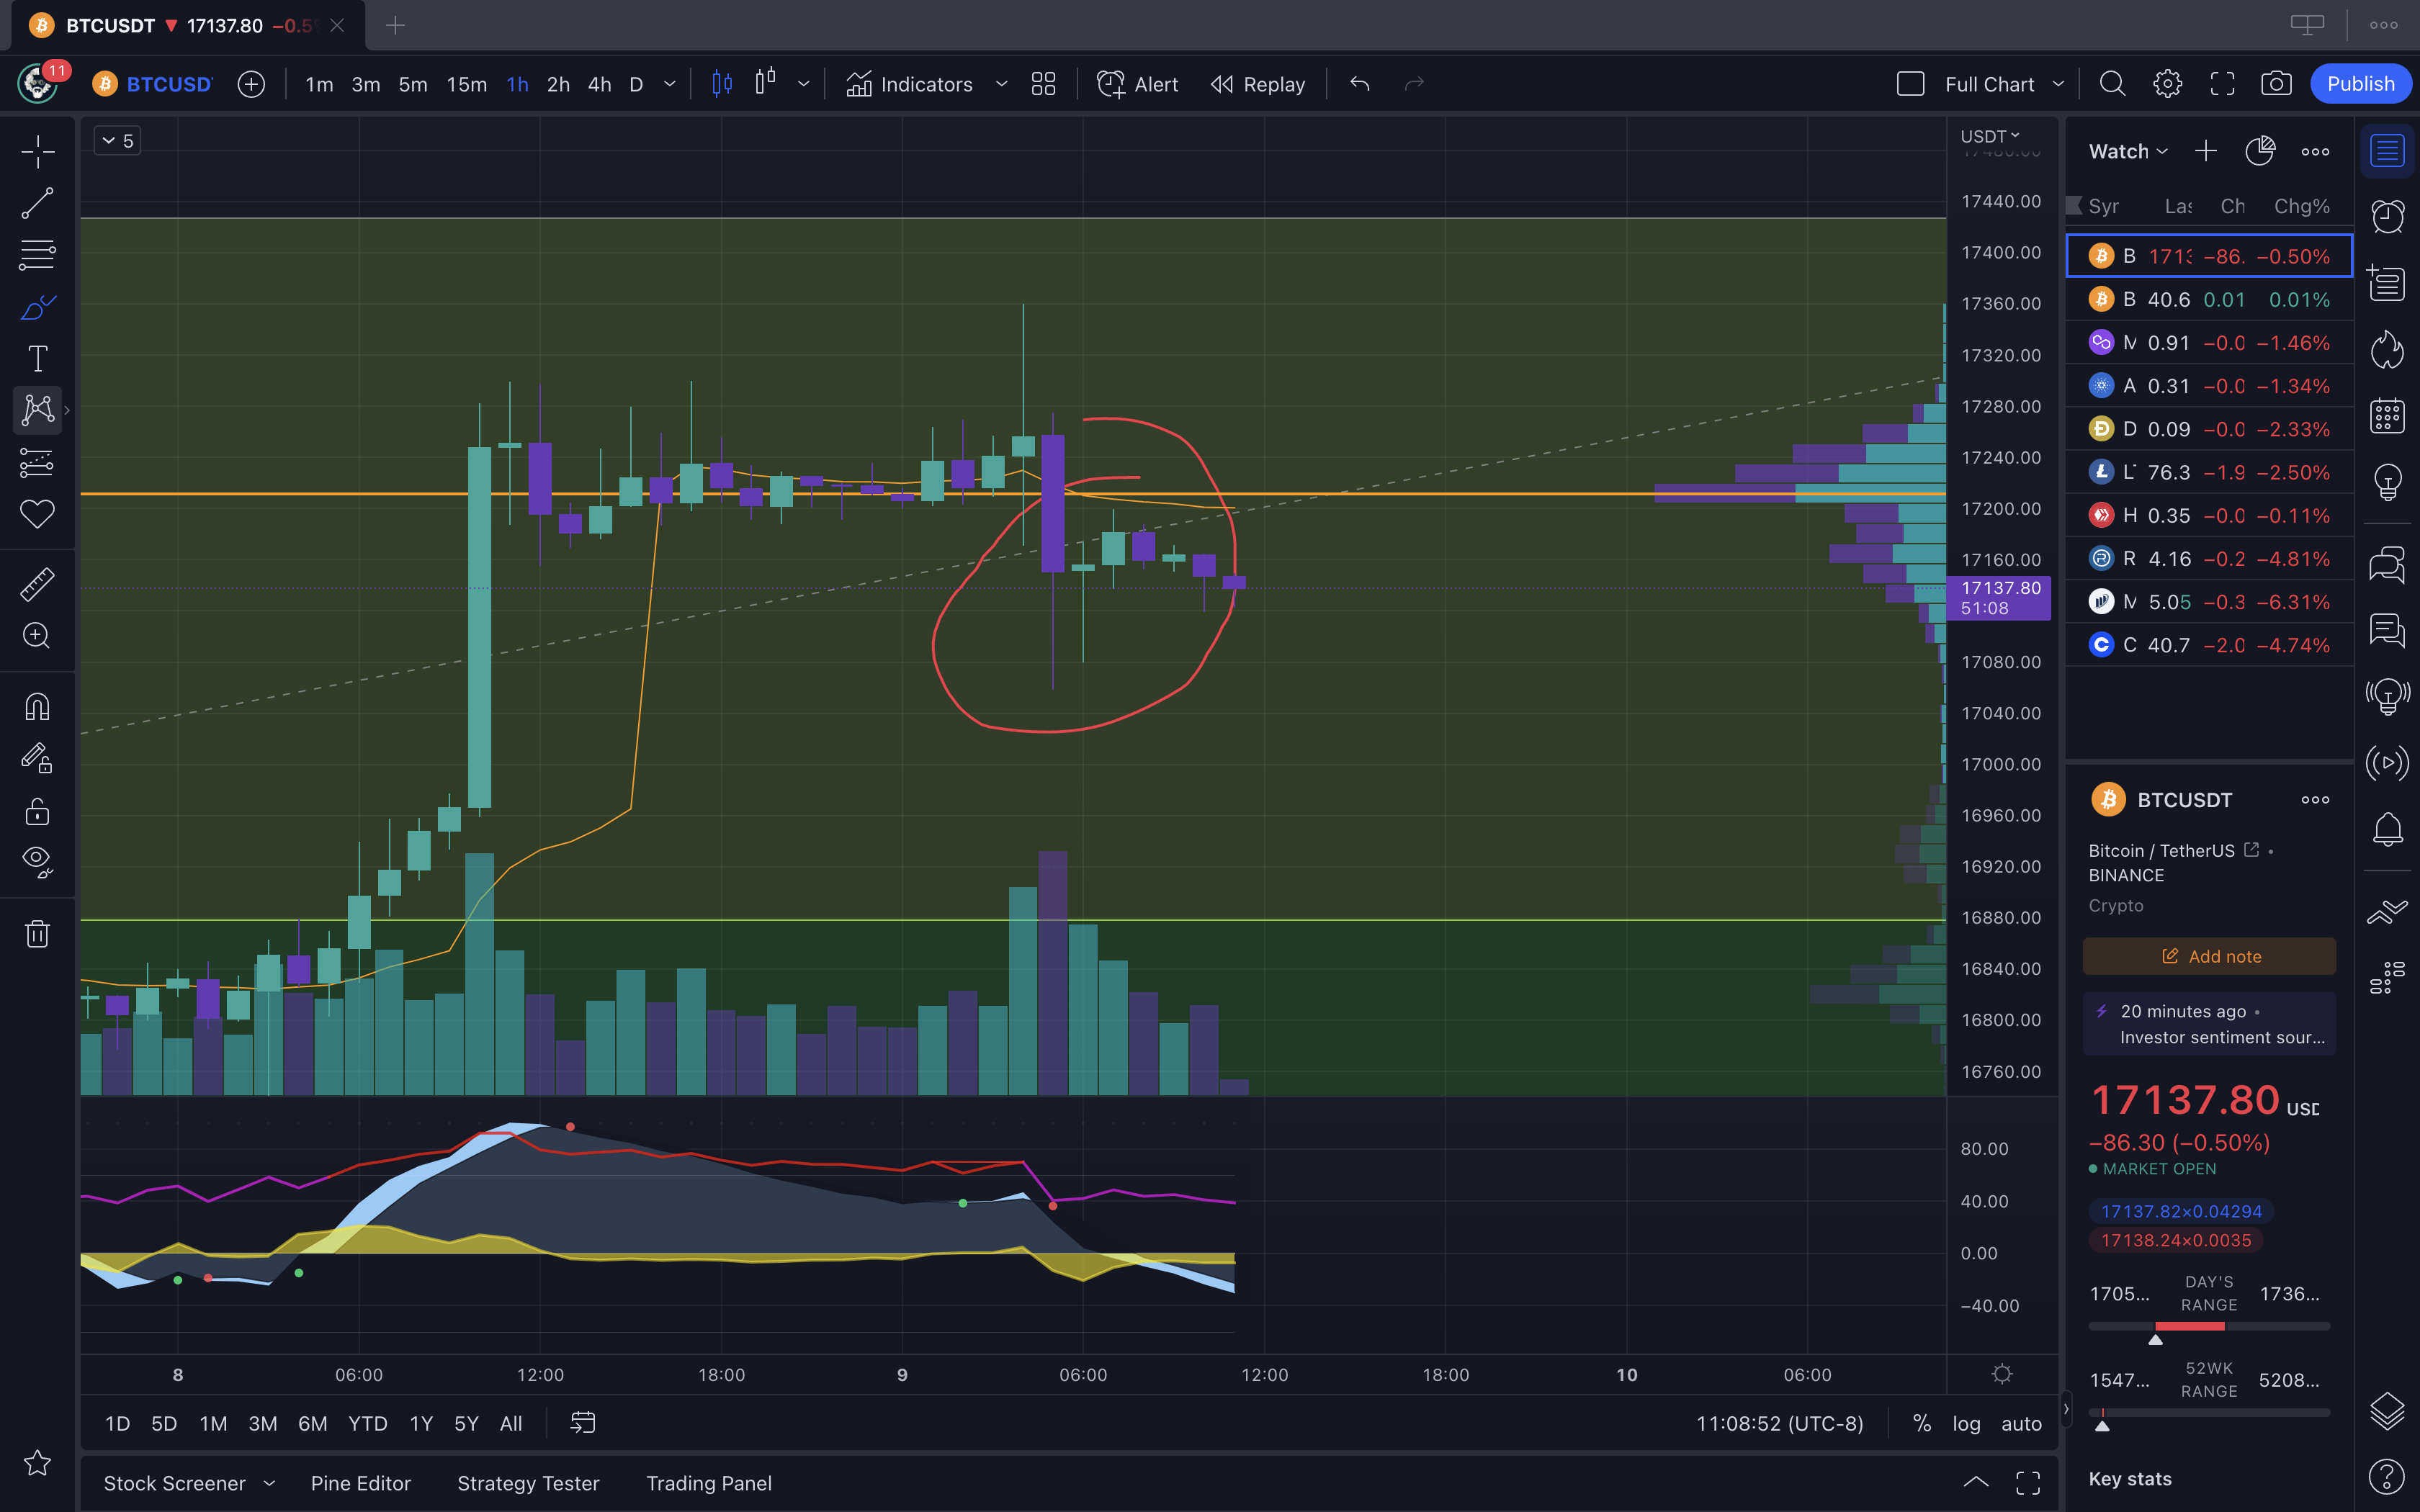
In the very next move, you can see an example of price absorption. You can see the price dropped and immediately bounced, then dropped again in the next candle to create a local higher low. This means that the sellers stopped selling at that price, or that there are an incredible amount of people buying up the asset at that price. In this case, we see that price has started to consolidate. Being that prices have found resistance, a good place to enter a short trade would be once price breaks and closes below the bottom of the previous candles.
Nothing In Trading Is Guaranteed
This is not always guaranteed, but in many cases is a great way to spot reversals. The story is told mainly in the price action and the volume. Everything else is really just noise. So no matter what you see other traders doing, you have to find what works for you. It’s best to start by learning the different price action candle patterns and using that and volume to find your trades. Anything else is a lagging indicator that really on helps you see if trends are forming and the momentum of the markets.
The market is only as complicated as you make it. Learning to read price action and volume will do wonders in your trading. The best idea is to take what you learn here, look back in time on the charts and find examples of doji candles and long-wick absorption candles, and see if that is a strategy that you can add to your trading playbook! It’s certainly one of our big trades and is part of our edge here at Coin Logic.

Nothing said is financial advice.
This is for educational and recreational purposes only!
Stay safe in these volatile markets and don’t get rekt!
Follow the markets and get the latest data and news on Coin Logic
Any videos will be posted to Coin Logic TV on YouTube in addition to 3Speak:
https://www.youtube.com/coinlogictv
Trade with me on Apollo X on BSC