What Is Your Favorite Trading Candle Type?

Every trader has their own style of chart that they like to look at. Whether it is just a visual preference, or they think that one style is better than the other, it’s what helps give a trader his or her edge. Different candle types will give you slightly different information, so depending on the type of trader you are, you may prefer one style over the other. Let’s get into the different types we use and why we use them here at the Coin Logic trading desk.
Standard Japanese Candlestick

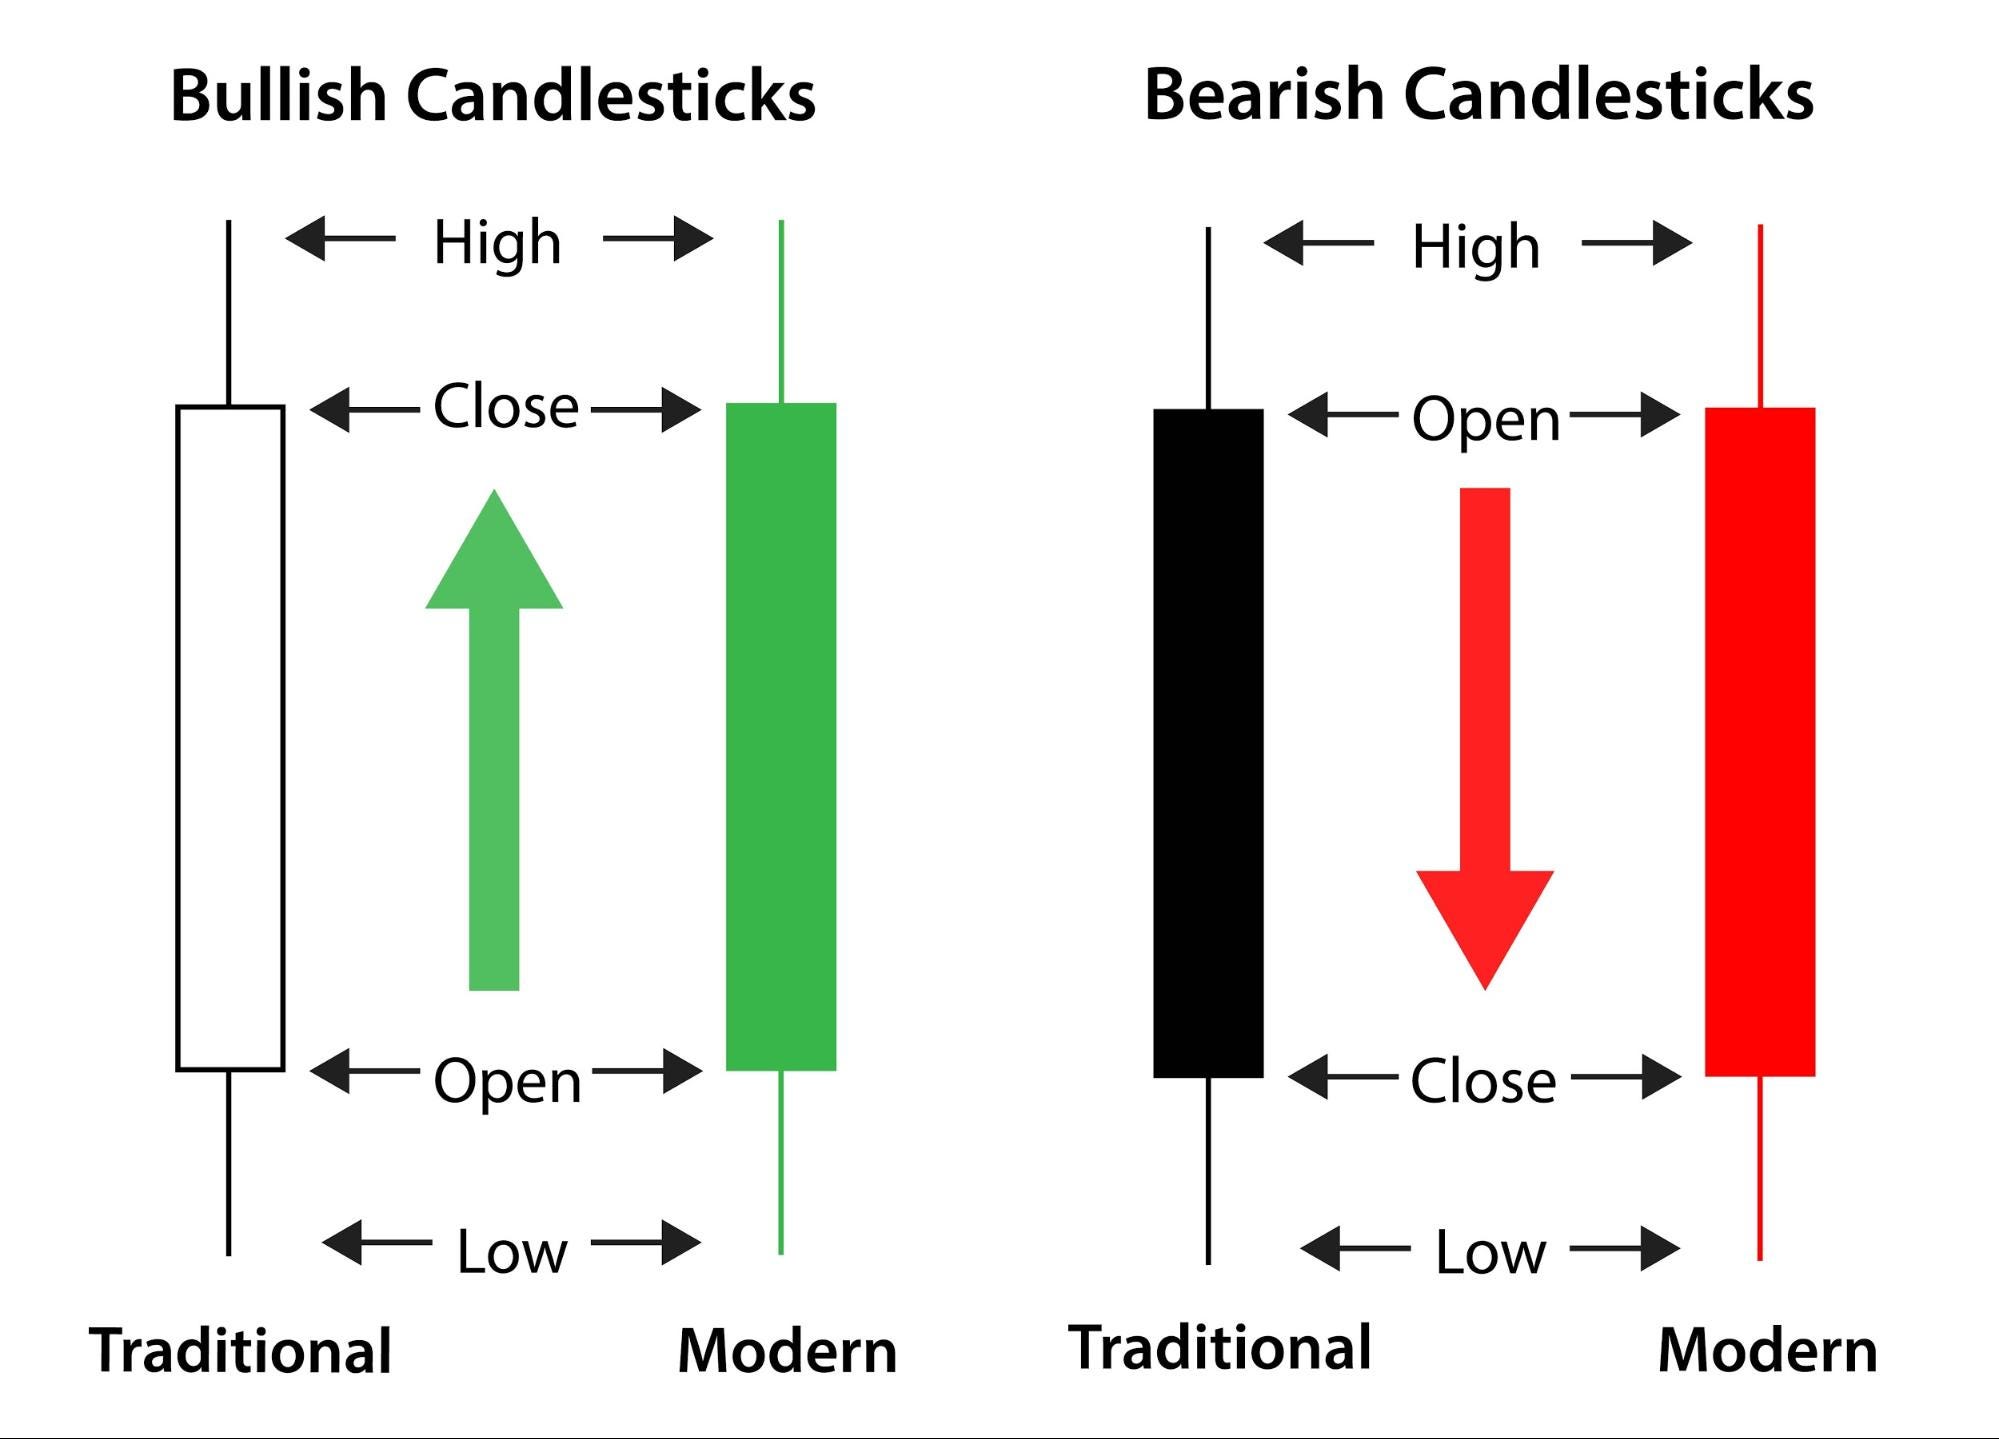
It is imperative for any trader to get to know the standard Japanese candlestick before moving on to any other style of chart. The standard candle shows a good bit of information about the price action. The candle body will tell you what the open price and close price, then the wicks will show you the high and low prices of that candle’s time period. So if we are looking at a 1 Day candlestick, the body will represent the open and close of the day, and the wicks will show the range of the price action with the highs and lows.
Bullish candles are by default green in color, but you can change this in the settings of your charting software. These candles happen when the close price of the candle is higher than the open price, indicating bullish, or upward price action.
Bearish candles are just the opposite. By default they are represented by the color red, and this happens when the closing price of the candle is lower than the open price. Pretty simple, huh?
Heiken Ashi Candlesticks

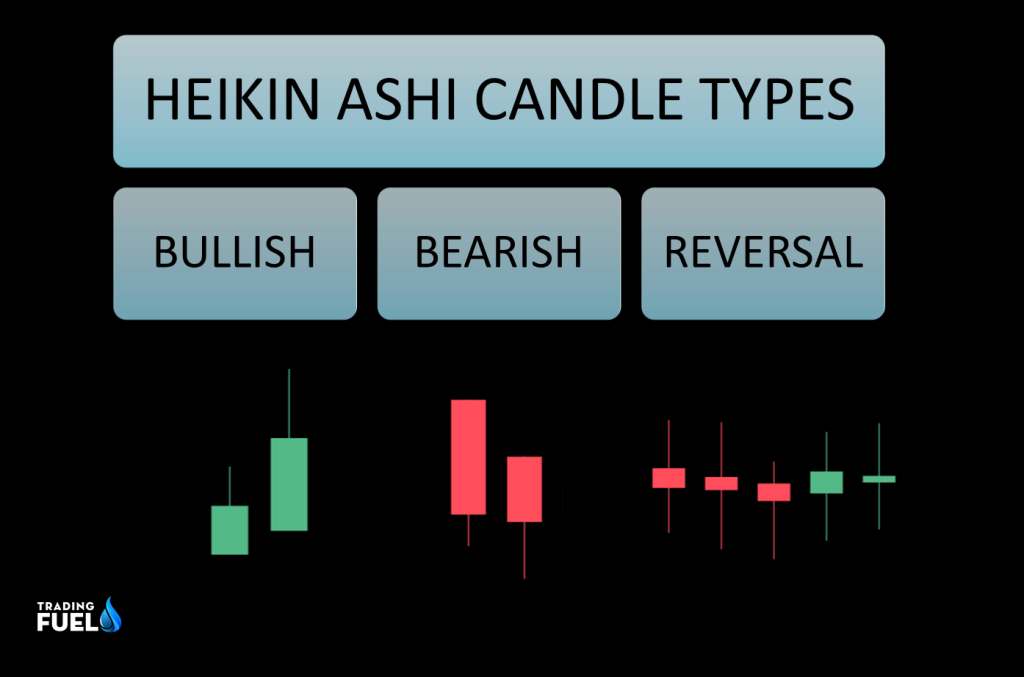
The heikin-ashi candle is a different type of Japanese trading candle. The words ‘heikin ashi’ means ‘average bar’ in Japanese, you might already get the idea behind this candle type. The heikin-ashi candle is used to better show the market trends. This helps with traders who are more swing traders as it helps to determine the overall trend and makes reading reversals much easier.
The heikin-ashi candle uses a formula to produce the candle price. Not only does it use the same information as the standard candle, but it also incorporates data from the previous candle to create the average. Instead of the open-high-close-low (OHCL)formula of the standard candle, the heikin-ashi runs on a formula of close-open-high-low (COHL). It looks a little something like this:
Close=1/4 (Open+High+Low+Close)(The average price of the current bar)
Open=1/2 (Open of Prev. Bar+Close of Prev. Bar)(The midpoint of the previous bar)
High=Max[High, Open, Close]
Low=Min[Low, Open, Close]
(Formula gathered from Investopedia)
By giving it more of an average price per timeframe, it creates a much smoother trend to follow.
:max_bytes(150000):strip_icc():format(webp)/dotdash_Final_Heikin-Ashi_A_Better_Candlestick_Sep_2020-01-9dc9b54816044794bd12de02f88f1d58.jpg)
You can see the difference in the chart patterns when using the standard versus the heikin-ashi candles. With normal candlesticks, the price shown is the price on the market, but the price on the heikin-ashi is based on the average movement tends to keep the candle red in a downtrend and green in an uptrend. This helps traders see a more pronounced trend where normal candles make things look choppy.
Using this style of charting candle can help with trader psychology in the way of allowing them to focus more on a trend than finding the exact top and bottom of a move. As a retail trader, you do not have the money to move the price action like the whales and institutional investors, so in most cases, it’s best to ride the trends, and the heikin-ashi candle can help you do that.
Choose Your Weapon, Or Use Both
The asset trading markets are a battlefield. The weapons you choose to use can make or break you in battle, so choose wisely. For us at the Coin Logic trading desk, we use a combination of candlestick patterns, depending on the style of trading that is happening at the time. For quick movement scalp trading, we use the standard candle because it allows more of a fast action with the price, but if we are on intra-day or longer swing trades, then we are looking at the heikin-ashi charts and riding the trends.
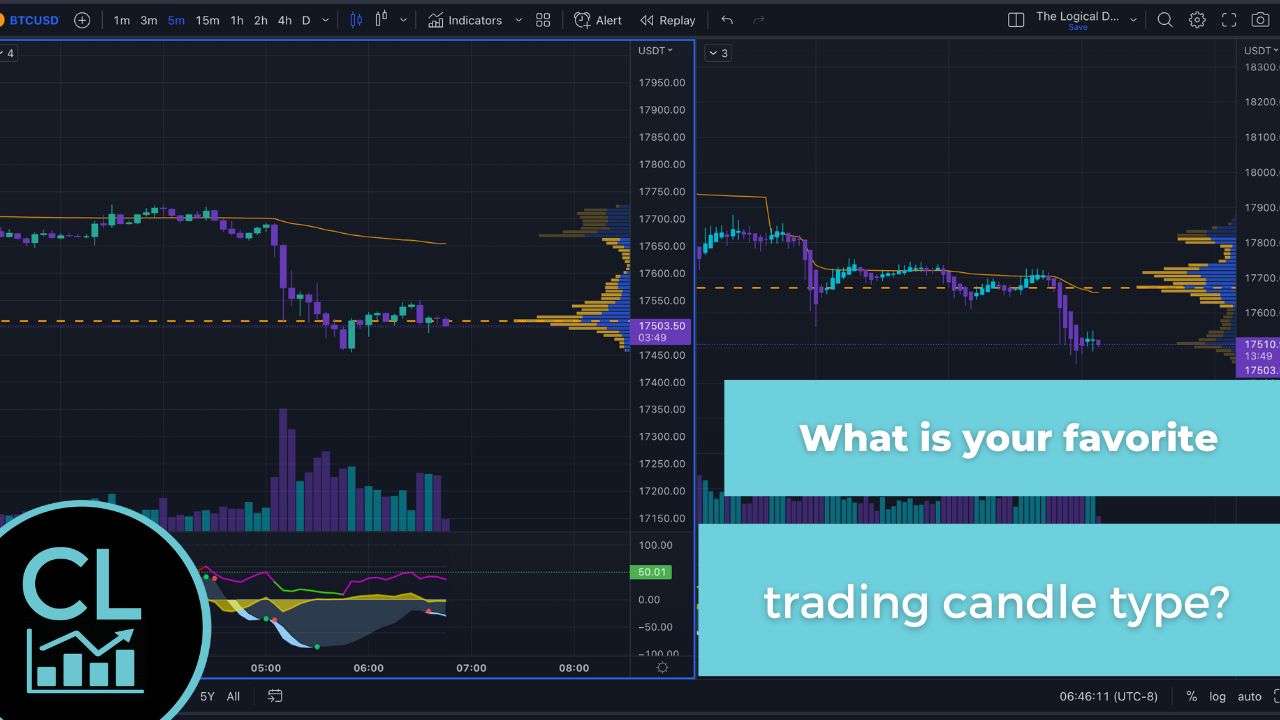
That’s not to say that the heikin-ashi cannot be used in scalp trading as well. Knowing the trends is half the battle, so using a split screen with heikin-ashi on one side with a slightly higher time frame like the 15-minute and the standard candles on a 5-minute chart or lower is a nice happy medium for us as it gives us the best of both worlds.
As we said in the beginning, every trader is different and has to find their own trading edge. Using and understanding multiple chart styles helps give us an edge in the markets and is a part of our trading playbook!
Let us know what your favorite pattern is and why in the comments! If you do not yet have a Hive blockchain account, you should really do that… Not financial advise, but, wise advise… Just saying…

Nothing said is financial advice.
This is for educational and recreational purposes only!
Stay safe in these volatile markets and don’t get rekt!
Follow the markets and get the latest data and news on Coin Logic
Any videos will be posted to Coin Logic TV on YouTube in addition to 3Speak:
https://www.youtube.com/coinlogictv
Trade with me on Apollo X on BSC

